
Details of the Proposed Redistribution Plan – Part A – Geographic pieces in which the number of districts has changed – Ontario
Northern Ontario
Northern Ontario Existing Districts

Text version of "Northern Ontario Existing Districts"
Labels show deviation from the 2022 Quota.
Proposal of the Federal Electoral Boundaries Commission for the Province of Ontario 2022
For detailed maps of the proposed electoral districts, please consult the map documents in the appendix or the Online Map Viewer.
| Electoral district | Deviation |
|---|---|
| Algoma—Manitoulin—Kapuskasing | -31.1% |
| Kenora | -44.9% |
| Nickel Belt | -18.6% |
| Nipissing—Timiskaming | -23.0% |
| Parry Sound—Muskoka | -10.4% |
| Sault Ste. Marie | -32.0% |
| Sudbury | -18.1% |
| Thunder Bay—Rainy River | -29.4% |
| Thunder Bay—Superior North | -28.5% |
| Timmins—James Bay | -30.7% |
Northern Ontario Proposed Districts

Text version of "Northern Ontario Proposed Districts"
Labels show deviation from the 2022 Quota.
Proposal of the Federal Electoral Boundaries Commission for the Province of Ontario 2022
For detailed maps of the proposed electoral districts, please consult the map documents in the appendix or the Online Map Viewer.
| Electoral district | Deviation |
|---|---|
| Cochrane—Timmins—Timiskaming | -8.2% |
| Kenora—Thunder Bay—Rainy River | -13.3% |
| Kiiwetinoong—Mushkegowuk | -68.8% |
| Manitoulin—Nickel Belt | -14.9% |
| Nipissing | -15.0% |
| Parry Sound—Muskoka | -12.3% |
| Sault Ste. Marie | -16.6% |
| Sudbury | -2.6% |
| Thunder Bay—Superior North | -15.1% |
There was only modest population growth in Northern Ontario over the past decade.
The population of Northern Ontario grew by 2.8%, from 831,984 in 2011 to 855,138 in 2021. The remainder of Ontario grew by 11.2% in the same period.
The populations and deviations from the Quota for the 10 existing electoral districts in Northern Ontario are shown in Table 1A. These districts have an average 2021 population of 85,513—a figure that is 26.7% below the Quota of 116,590. While Kenora was deemed an extraordinary circumstances
district in the 2012 electoral map, there are presently five additional districts with populations that fall more than 25 per cent below the 2022 Quota.
| Electoral Districts | Population – 2011 | Deviation from Quota – 2012 | Population – 2021 | Deviation from Quota – 2022 |
|---|---|---|---|---|
| Algoma—Manitoulin—Kapuskasing | 79,801 | -24.87% | 80,310 | -31.12% |
| Kenora (Extraordinary Circumstance) | 55,977 | -47.30% | 64,261 | -44.88% |
| Nickel Belt | 90,962 | -14.36% | 94,947 | -18.56% |
| Nipissing—Timiskaming | 90,996 | -14.33% | 89,781 | -22.99% |
| Parry Sound—Muskoka | 91,233 | -14.10% | 104,494 | -10.37% |
| Sault Ste. Marie | 82,052 | -22.75% | 79,331 | -31.96% |
| Sudbury | 92,048 | -13.34% | 95,537 | -18.06% |
| Thunder Bay—Rainy River | 82,984 | -21.87% | 82,357 | -29.36% |
| Thunder Bay—Superior North | 82,827 | -22.02% | 83,325 | -28.53% |
| Timmins—James Bay | 83,104 | -21.76% | 80,785 | -30.71% |
| Average | 83,198 | -21.67% | 85,513 | -26.65% |
| Range (most populous to least populous) | 36,071 | 33.96 pp | 40,233 | 34.51 pp |
| Average – Excluding Extraordinary Circumstance | 86,223 | -18.82% | 87,874 | -24.63% |
| Range – Excluding Extraordinary Circumstance | 12,247 | 11.53 pp | 25,163 | 21.59 pp |
pp = percentage points
Given these extreme disparities from population equality and the distinctive challenges of representation in the North, the Commission discussed at great length the meaning of 'effective representation' and the challenges of balancing the considerations set forth under the Electoral Boundaries Readjustment Act.
The Commission noted that in 2016 the province of Ontario established the Far North Electoral Boundaries Commission to make recommendations regarding the creation of at least one, and no more than two, new provincial electoral districts from the geography of the current provincial electoral districts of Kenora—Rainy River and Timmins—James Bay.
This Commission further noted the distinctions between its own mandate as set out in the rules prescribed by the federal Electoral Boundaries Readjustment Act and the legislative mandate of the Ontario Far North Electoral Boundaries Commission. Our Commission is constrained by its mandate and by the smaller number of districts to be created.
The census population data and mandate respecting voter parity revealed the potential for a reduction of two electoral districts in Northern Ontario. The Commission considered this possibility but decided to propose a reduction of one district, thus resulting in nine districts in total, including one extraordinary circumstances
district. The Commission acknowledged that most of the eight non-extraordinary districts in Northern Ontario have significant deviations from the Quota (see Table 1B). However, the Commission concluded that any further reduction in the number of districts in the North would imperil the principle of effective representation in this part of the province, considering its widely dispersed population and communities of interest.
The proposed redistribution plan establishes one extraordinary circumstances
district which encompasses and reflects the exceptional nature of the far North—an isolated and geographically substantial area, in large part not accessible by road, in which the majority of the population is Indigenous. While geographically vast (520,307 square kilometers), the proposed district of Kiiwetinoong—Mushkegowuk would not be the largest in Canada and, furthermore, is accessible via regular flight routes (from the Timmins hub along the James Bay coast and from hubs in Thunder Bay, Sioux Lookout and Winnipeg serving the western portion).
The eight other proposed electoral districts in Northern Ontario are of manageable geographic size, and accessible via the well-established roadway network anchored by Highways 11 and 17. Their boundaries have also been redrawn to reduce the large deviations from the Quota.
As previously noted, where a community of Francophones represented a substantial percentage of a riding, the proposed boundaries ensure that their representation is not diluted or diminished within this redistribution plan.
In addition to the proposed riding name of Kiiwetinoong—Mushkegowuk, other reconfigured districts have been renamed to reflect the communities comprising them.
The new deviations from the Quota in the proposed redistribution plan are shown in Table 1B.
| Electoral Districts | Population – 2021 | Deviation from Quota – 2022 |
|---|---|---|
| Cochrane—Timmins—Timiskaming | 107,092 | -8.15% |
| Kenora—Thunder Bay—Rainy River | 101,097 | -13.29% |
| Kiiwetinoong—Mushkegowuk (Extraordinary Circumstance) | 36,325 | -68.84% |
| Manitoulin—Nickel Belt | 99,268 | -14.86% |
| Nipissing | 99,149 | -14.96% |
| Parry Sound—Muskoka | 102,255 | -12.30% |
| Sault Ste. Marie | 97,299 | -16.55% |
| Sudbury | 113,618 | -2.55% |
| Thunder Bay—Superior North | 99,035 | -15.06% |
| Average | 95,015 | -18.51% |
| Range (most populous to least populous) | 77,293 | 66.29 pp |
| Average – Excluding Extraordinary Circumstance | 102,352 | -12.22% |
| Range – Excluding Extraordinary Circumstance | 16,319 | 14.00 pp |
pp = percentage points
City of Toronto
City of Toronto Existing Districts

Text version of "City of Toronto Existing Districts"
Labels show deviation from the 2022 Quota.
Proposal of the Federal Electoral Boundaries Commission for the Province of Ontario 2022
For detailed maps of the proposed electoral districts, please consult the map documents in the appendix or the Online Map Viewer.
| Electoral district | Deviation |
|---|---|
| Beaches—East York | -6.2% |
| Davenport | -9.1% |
| Don Valley East | -18.5% |
| Don Valley North | -2.5% |
| Don Valley West | -12.6% |
| Eglinton—Lawrence | -0.7% |
| Etobicoke Centre | 1.6% |
| Etobicoke North | -0.5% |
| Etobicoke—Lakeshore | 21.6% |
| Humber River—Black Creek | -4.3% |
| Parkdale—High Park | -8.4% |
| Scarborough—Agincourt | -10.4% |
| Scarborough Centre | -3.0% |
| Scarborough—Guildwood | -11.3% |
| Scarborough North | -18.8% |
| Scarborough—Rouge Park | -12.3% |
| Scarborough Southwest | -3.9% |
| Spadina—Fort York | 16.8% |
| Toronto Centre | 2.8% |
| Toronto—Danforth | -9.5% |
| Toronto—St. Paul's | 0.3% |
| University—Rosedale | -8.9% |
| Willowdale | 1.4% |
| York Centre | -7.1% |
| York South—Weston | 0.1% |
City of Toronto Proposed Districts
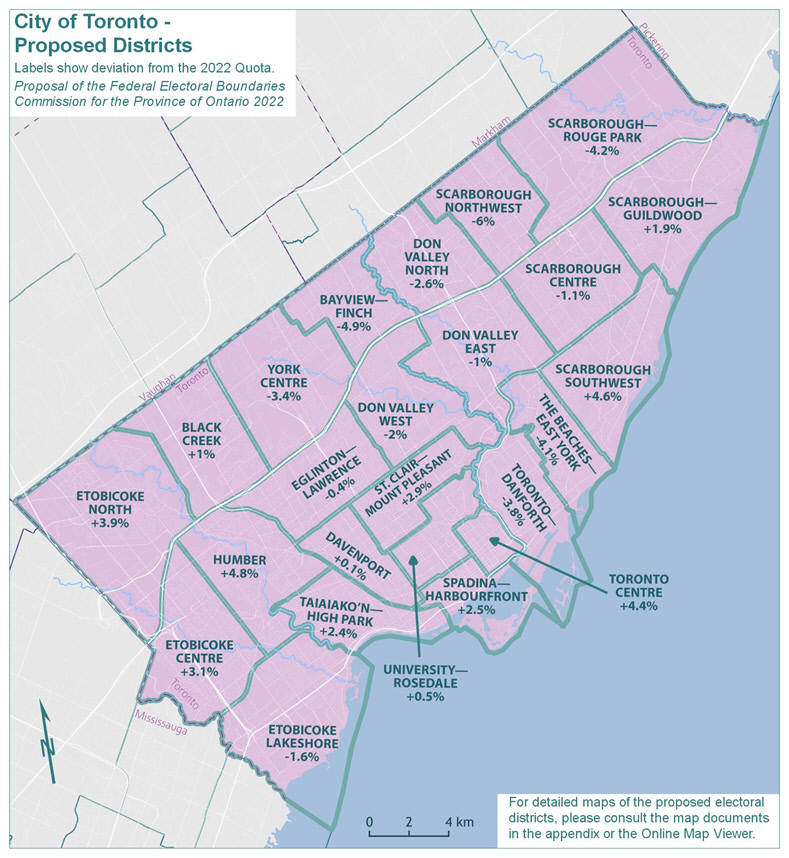
Text version of "City of Toronto Proposed Districts"
Labels show deviation from the 2022 Quota.
Proposal of the Federal Electoral Boundaries Commission for the Province of Ontario 2022
For detailed maps of the proposed electoral districts, please consult the map documents in the appendix or the Online Map Viewer.
| Electoral district | Deviation |
|---|---|
| Bayview—Finch | -4.9% |
| Black Creek | 1.0% |
| Davenport | 0.1% |
| Don Valley East | -1.0% |
| Don Valley North | -2.6% |
| Don Valley West | -2.0% |
| Eglinton—Lawrence | -0.4% |
| Etobicoke Centre | 3.1% |
| Etobicoke Lakeshore | -1.6% |
| Etobicoke North | 3.9% |
| Humber | 4.8% |
| Scarborough Centre | -1.1% |
| Scarborough—Guildwood | 1.9% |
| Scarborough Northwest | -6.0% |
| Scarborough—Rouge Park | -4.2% |
| Scarborough Southwest | 4.6% |
| Spadina—Harbourfront | 2.5% |
| St. Clair—Mount Pleasant | 2.9% |
| Taiaiako'n—High Park | 2.4% |
| The Beaches—East York | -4.1% |
| Toronto Centre | 4.4% |
| Toronto—Danforth | -3.8% |
| University—Rosedale | 0.5% |
| York Centre | -3.4% |
The population of Toronto grew by 6.9%, from 2,615,060 in 2011 to 2,794,356 in 2021. The remainder of Ontario grew by 11.7% in the same period.
The existing 25 electoral districts in Toronto would have an average 2021 population of 111,774—a figure that falls 4.1% below the Quota of 116,590. Furthermore, as indicated by the range of deviations relative to the 2022 Quota (40.3 percentage points), there are substantial disparities in the population size of districts across the City of Toronto. The populations and deviations from the Quota for the existing electoral districts are shown in Table 2A.
| Electoral Districts | Population ‒ 2011 | Deviation from Quota ‒ 2012 | Population ‒ 2021 | Deviation from Quota ‒ 2022 |
|---|---|---|---|---|
| Beaches—East York | 107,084 | 0.82% | 109,359 | -6.20% |
| Davenport | 102,360 | -3.63% | 105,946 | -9.13% |
| Don Valley East | 93,007 | -12.43% | 95,039 | -18.48% |
| Don Valley North | 103,073 | -2.96% | 113,663 | -2.51% |
| Don Valley West | 99,820 | -6.02% | 101,959 | -12.55% |
| Eglinton—Lawrence | 113,150 | 6.53% | 115,832 | -0.65% |
| Etobicoke Centre | 114,910 | 8.19% | 118,483 | 1.62% |
| Etobicoke—Lakeshore | 115,437 | 8.68% | 141,751 | 21.58% |
| Etobicoke North | 117,601 | 10.72% | 116,003 | -0.50% |
| Humber River—Black Creek | 108,198 | 1.87% | 111,593 | -4.29% |
| Parkdale—High Park | 105,103 | -1.05% | 106,750 | -8.44% |
| Scarborough—Agincourt | 104,499 | -1.61% | 104,423 | -10.44% |
| Scarborough Centre | 108,826 | 2.46% | 113,104 | -2.99% |
| Scarborough—Guildwood | 101,914 | -4.05% | 103,449 | -11.27% |
| Scarborough North | 101,080 | -4.83% | 94,717 | -18.76% |
| Scarborough—Rouge Park | 102,646 | -3.36% | 102,254 | -12.30% |
| Scarborough Southwest | 106,733 | 0.49% | 111,994 | -3.94% |
| Spadina—Fort York | 82,480 | -22.35% | 136,213 | 16.83% |
| Toronto Centre | 93,971 | -11.53% | 119,901 | 2.84% |
| Toronto—Danforth | 104,017 | -2.07% | 105,472 | -9.54% |
| Toronto—St. Paul's | 103,983 | -2.10% | 116,953 | 0.31% |
| University—Rosedale | 98,605 | -7.16% | 106,216 | -8.90% |
| Willowdale | 109,680 | 3.26% | 118,218 | 1.40% |
| York Centre | 100,277 | -5.59% | 108,307 | -7.10% |
| York South—Weston | 116,606 | 9.78% | 116,757 | 0.14% |
| Average | 104,602 | -1.52% | 111,774 | -4.13% |
| Range (most populous to least populous) | 35,121 | 33.07 pp | 47,034 | 40.34 pp |
pp = percentage points
The Commission noted that the overrepresentation in Toronto has emerged due to uneven population growth between Toronto and surrounding areas, which is expected to continue or increase in the future.
As a result, the Commission concluded that the districts in Toronto be reduced by one.
This reduction, together with the obligation to address the wide population disparities of electoral districts within the City of Toronto, has required shifting many boundaries. The most significant proposed changes fall in the eastern portion of the City of Toronto, particularly around Scarborough, where deviations below the Quota were most pronounced. This area, broadly described as lying to the east of Victoria Park Avenue, has been reduced from six districts to five.
Proposed new electoral boundaries are formed by City of Toronto boundaries and, for the most part, follow the contours of major highways, roads, rail lines, ravines, and rivers.
Several district names have been changed to better describe their locations or reflect the neighbourhoods and communities that comprise these reconfigured districts.
With 24 districts, the average population in each district becomes 116,432. The maximum deviation from the Quota is 6%. The new deviations from the Quota in the proposed redistribution plan are shown in Table 2B.
| Electoral Districts | Population ‒ 2021 | Deviation from Quota ‒ 2022 |
|---|---|---|
| Bayview—Finch | 110,908 | -4.87% |
| Black Creek | 117,740 | 0.99% |
| Davenport | 116,728 | 0.12% |
| Don Valley East | 115,456 | -0.97% |
| Don Valley North | 113,537 | -2.62% |
| Don Valley West | 114,229 | -2.03% |
| Eglinton—Lawrence | 116,139 | -0.39% |
| Etobicoke Centre | 120,157 | 3.06% |
| Etobicoke Lakeshore | 114,714 | -1.61% |
| Etobicoke North | 121,107 | 3.87% |
| Humber | 122,220 | 4.83% |
| Scarborough Centre | 115,260 | -1.14% |
| Scarborough—Guildwood | 118,754 | 1.86% |
| Scarborough Northwest | 109,568 | -6.02% |
| Scarborough—Rouge Park | 111,713 | -4.18% |
| Scarborough Southwest | 121,947 | 4.59% |
| Spadina—Harbourfront | 119,497 | 2.49% |
| St. Clair—Mount Pleasant | 119,935 | 2.87% |
| Taiaiako'n—High Park | 119,421 | 2.43% |
| The Beaches—East York | 111,805 | -4.10% |
| Toronto Centre | 121,703 | 4.39% |
| Toronto—Danforth | 112,119 | -3.83% |
| University—Rosedale | 117,119 | 0.45% |
| York Centre | 112,580 | -3.44% |
| Average | 116,432 | -0.14% |
| Range (most populous to least populous) | 12,652 | 10.85 pp |
pp = percentage points
Halton, Guelph, and Wellington
Halton, Guelph, and Wellington Existing Districts
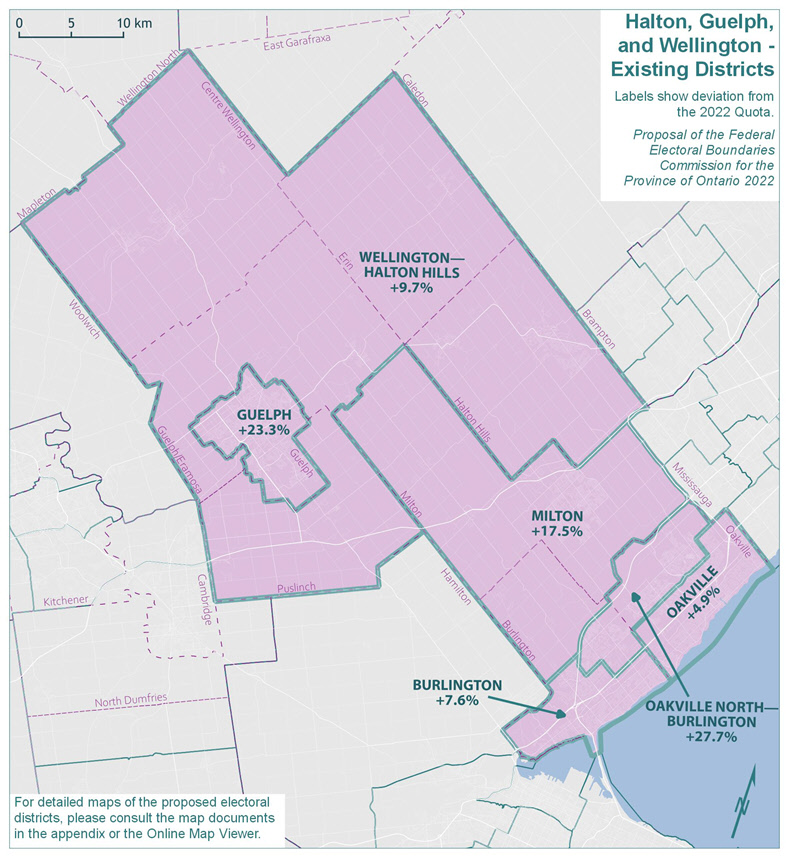
Text version of "Halton, Guelph, and Wellington Existing Districts"
Labels show deviation from the 2022 Quota.
Proposal of the Federal Electoral Boundaries Commission for the Province of Ontario 2022
For detailed maps of the proposed electoral districts, please consult the map documents in the appendix or the Online Map Viewer.
| Electoral district | Deviation |
|---|---|
| Burlington | 7.6% |
| Guelph | 23.3% |
| Milton | 17.5% |
| Oakville | 4.9% |
| Oakville North—Burlington | 27.7% |
| Wellington—Halton Hills | 9.7% |
Halton, Guelph, and Wellington Proposed Districts

Text version of "Halton, Guelph, and Wellington Proposed Districts"
Labels show deviation from the 2022 Quota.
Proposal of the Federal Electoral Boundaries Commission for the Province of Ontario 2022
For detailed maps of the proposed electoral districts, please consult the map documents in the appendix or the Online Map Viewer.
| Electoral district | Deviation |
|---|---|
| Burlington Lakeshore | 0.3% |
| Burlington—Milton West | -2.0% |
| Georgetown—Milton East | 1.7% |
| Guelph | 1.8% |
| Oakville Lakeshore | -1.4% |
| Oakville North | -2.6% |
| Wellington—Halton | -4.7% |
The population of Halton, Guelph, and Wellington grew by 18.4%, from 680,234 in 2011 to 805,299 in 2021. The remainder of Ontario grew by 10.2% in the same period.
The six electoral districts in this geographic piece would have an average 2021 population of 134,217 and an average deviation of 15.1% above the Quota. The existing districts of Oakville North—Burlington, Guelph and Milton are at the highest end for population size across the province, with populations that are, respectively, 27.7%, 23.3% and 17.5% above the Quota. The populations and deviations from the Quota for the existing electoral districts are shown in Table 3A.
| Electoral Districts | Population ‒ 2011 | Deviation from Quota ‒ 2012 | Population ‒ 2021 | Deviation from Quota ‒ 2022 |
|---|---|---|---|---|
| Burlington | 120,569 | 13.52% | 125,435 | 7.59% |
| Guelph | 121,688 | 14.57% | 143,740 | 23.29% |
| Milton | 88,065 | -17.09% | 136,993 | 17.50% |
| Oakville | 119,649 | 12.65% | 122,322 | 4.92% |
| Oakville North—Burlington | 114,378 | 7.69% | 148,936 | 27.74% |
| Wellington—Halton Hills | 115,885 | 9.11% | 127,873 | 9.68% |
| Average | 113,372 | 6.74% | 134,217 | 15.12% |
| Range (most populous to least populous) | 33,623 | 31.66 pp | 26,614 | 22.82 pp |
pp = percentage points
The Commission proposes a new electoral district to resolve the underrepresentation in these districts, considering the current population and anticipated population growth.
This proposal sees five districts in the southernmost part of this geographic piece, where there were previously four. These southernmost districts are now much more balanced in population size and correspond more closely with the boundaries of Halton Region. In the northern part of this geographic piece, the revised district of Wellington—Halton picks up portions of Guelph, thus bringing the population of the district of Guelph much closer to the provincial quotient.
The new deviations from the Quota in the proposed redistribution plan are shown in Table 3B.
| Electoral Districts | Population ‒ 2021 | Deviation from Quota ‒ 2022 |
|---|---|---|
| Burlington Lakeshore | 116,984 | 0.34% |
| Burlington—Milton West | 114,218 | -2.03% |
| Georgetown—Milton East | 118,559 | 1.69% |
| Guelph | 118,686 | 1.80% |
| Oakville Lakeshore | 114,917 | -1.43% |
| Oakville North | 113,574 | -2.59% |
| Wellington—Halton | 111,155 | -4.66% |
| Average | 115,442 | -0.98% |
| Range (most populous to least populous) | 7,531 | 6.46 pp |
pp = percentage points
Brampton, Caledon, and Dufferin
Brampton, Caledon, and Dufferin Existing Districts
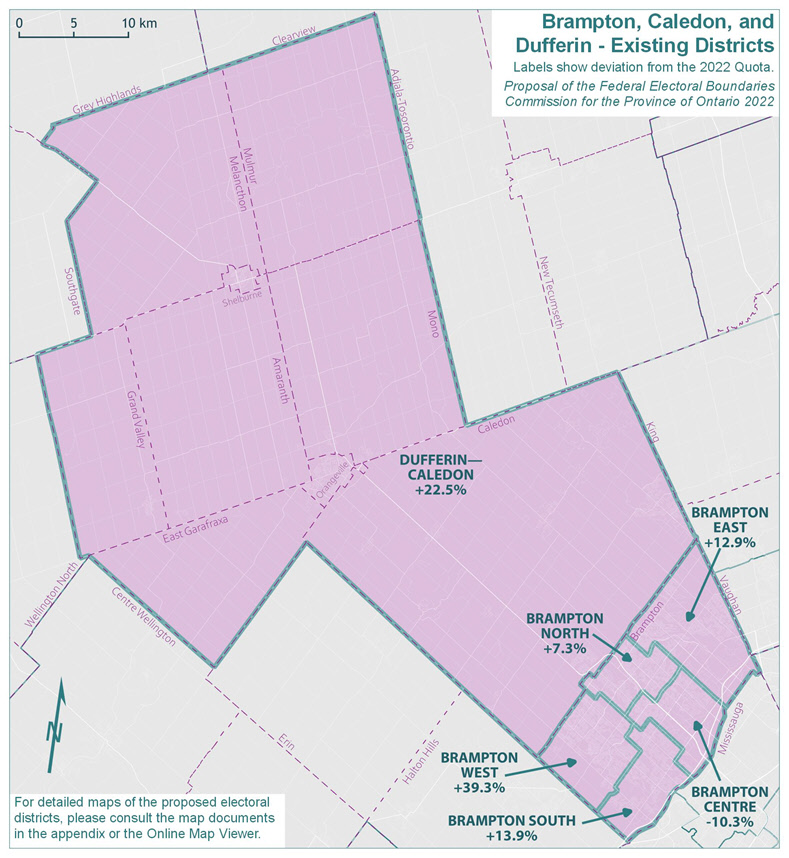
Text version of "Brampton, Caledon, and Dufferin Existing Districts"
Labels show deviation from the 2022 Quota.
Proposal of the Federal Electoral Boundaries Commission for the Province of Ontario 2022
For detailed maps of the proposed electoral districts, please consult the map documents in the appendix or the Online Map Viewer.
| Electoral district | Deviation |
|---|---|
| Brampton Centre | -10.3% |
| Brampton East | 12.9% |
| Brampton North | 7.3% |
| Brampton South | 13.9% |
| Brampton West | 39.3% |
| Dufferin—Caledon | 22.5% |
Brampton, Caledon, and Dufferin Proposed Districts
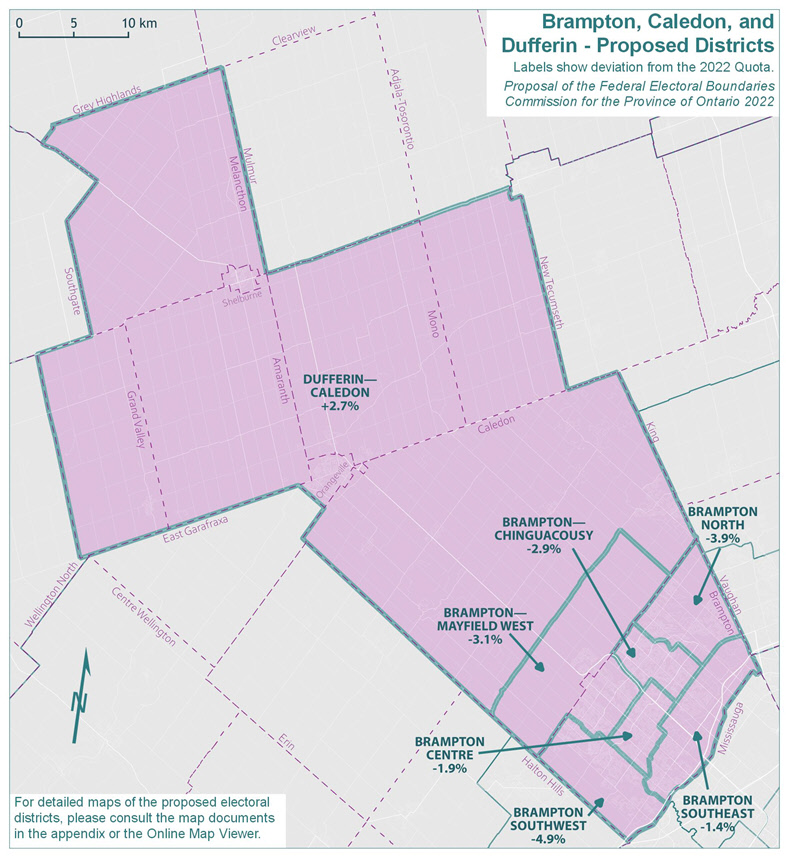
Text version of "Brampton, Caledon, and Dufferin Proposed Districts"
Labels show deviation from the 2022 Quota.
Proposal of the Federal Electoral Boundaries Commission for the Province of Ontario 2022
For detailed maps of the proposed electoral districts, please consult the map documents in the appendix or the Online Map Viewer.
| Electoral district | Deviation |
|---|---|
| Brampton Centre | -1.9% |
| Brampton—Chinguacousy | -2.9% |
| Brampton—Mayfield West | -3.1% |
| Brampton North | -3.9% |
| Brampton Southeast | -1.4% |
| Brampton Southwest | -4.9% |
| Dufferin—Caledon | 2.7% |
Brampton is another area that has seen considerable population growth over the past decade. The City of Brampton itself, with a current population of 656,480, has risen by 25.3% since 2011, with density spreading northward into Caledon and Dufferin County. This is the largest population growth of any Ontario city with a population over 100,000. Taken as a geographic piece, the population of Brampton, Caledon, and Dufferin grew by 24.8%, from 640,247 in 2011 to 799,318 in 2021. The remainder of Ontario grew by 9.9% in the same period.
The existing six electoral districts in this geographic piece would have an average 2021 population of 133,220, which falls 14.3% above the Quota. Brampton West (with 162,353 residents) currently has the highest population of all districts in the province, while Dufferin—Caledon also falls near the top. As indicated by the deviation range (49.6 percentage points) relative to the 2022 Quota, there are substantial disparities in population size between districts, particularly between the adjacent ridings of Brampton West and Brampton Centre. The populations and deviations from the Quota for the existing electoral districts are shown in Table 4A.
| Electoral Districts | Population ‒ 2011 | Deviation from Quota ‒ 2012 | Population ‒ 2021 | Deviation from Quota ‒ 2022 |
|---|---|---|---|---|
| Brampton Centre | 103,122 | -2.91% | 104,557 | -10.32% |
| Brampton East | 99,712 | -6.12% | 131,677 | 12.94% |
| Brampton North | 111,951 | 5.40% | 125,141 | 7.33% |
| Brampton South | 107,364 | 1.08% | 132,752 | 13.86% |
| Brampton West | 101,757 | -4.20% | 162,353 | 39.25% |
| Dufferin—Caledon | 116,341 | 9.53% | 142,838 | 22.51% |
| Average | 106,708 | 0.46% | 133,220 | 14.26% |
| Range (most populous to least populous) | 16,629 | 15.65 pp | 57,796 | 49.57 pp |
pp = percentage points
Given its population size and anticipated growth, the Commission concluded that this area requires a new electoral district.
The proposed addition of a seventh district, together with the obligation to address the wide population disparities described above, requires significant boundary reconfigurations, especially of those districts that lay within the City of Brampton.
These proposed district boundaries all align with historical boundaries between the City of Brampton and the City of Mississauga (to the south), the Regional Municipality of Halton (to the west), and the City of Vaughan and the Township of King (to the east). However, the proposed district of Brampton—Mayfield West extends northward beyond the municipal boundary to pick up a portion of the neighbouring district of Dufferin—Caledon. These revised boundaries thus reduce the population of the Dufferin—Caledon district, drawing it closer to the Quota.
Pursuant to the proposed redistribution plan, these seven districts in this geographic piece all have comparable populations and manageable geographic size and respect as much as possible distinctive historical communities.
The new deviations from the Quota in the proposed redistribution plan are shown in Table 4B.
| Electoral Districts | Population ‒ 2021 | Deviation from Quota ‒ 2022 |
|---|---|---|
| Brampton Centre | 114 422 | -1.86% |
| Brampton—Chinguacousy | 113,201 | -2.91% |
| Brampton—Mayfield West | 112,994 | -3.08% |
| Brampton North | 112,082 | -3.87% |
| Brampton Southeast | 114,952 | -1.40% |
| Brampton Southwest | 110,855 | -4.92% |
| Dufferin—Caledon | 119,767 | 2.72% |
| Average | 114,039 | -2.19% |
| Range (most populous to least populous) | 8,912 | 7.64 pp |
pp = percentage points
Central Ontario, Eastern Greater Toronto Area, & Northern Greater Toronto Area
Central Ontario, Eastern GTA, and Northern GTA
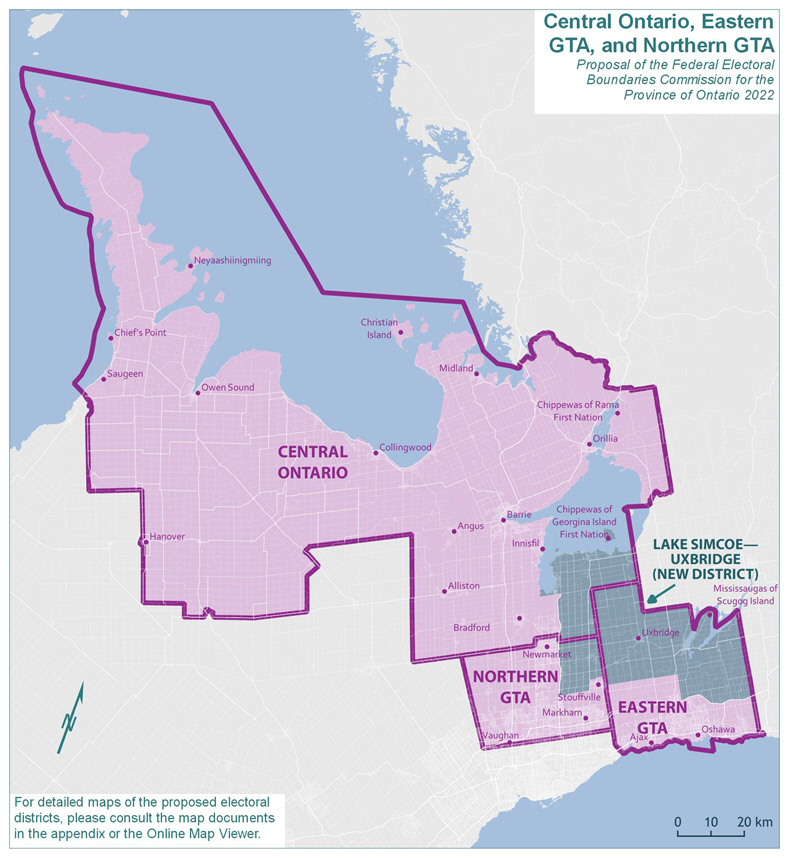
Text version of "Central Ontario, Eastern GTA, and Northern GTA"
Proposal of the Federal Electoral Boundaries Commission for the Province of Ontario 2022
For detailed maps of the proposed electoral districts, please consult the map documents in the appendix or the Online Map Viewer.
We turn next to the broad region fanning north from the Greater Toronto Area (GTA) towards Georgian Bay, Lake Simcoe, and Lake Scugog. The Commission proposes the addition of a single new electoral district, Lake Simcoe—Uxbridge, which lies at the geographic centre of this region and has implications cascading outward. We present this discussion in three geographic pieces, beginning with Central Ontario, moving down to Northern GTA, then across to Eastern GTA.
Central Ontario
Central Ontario Existing Districts
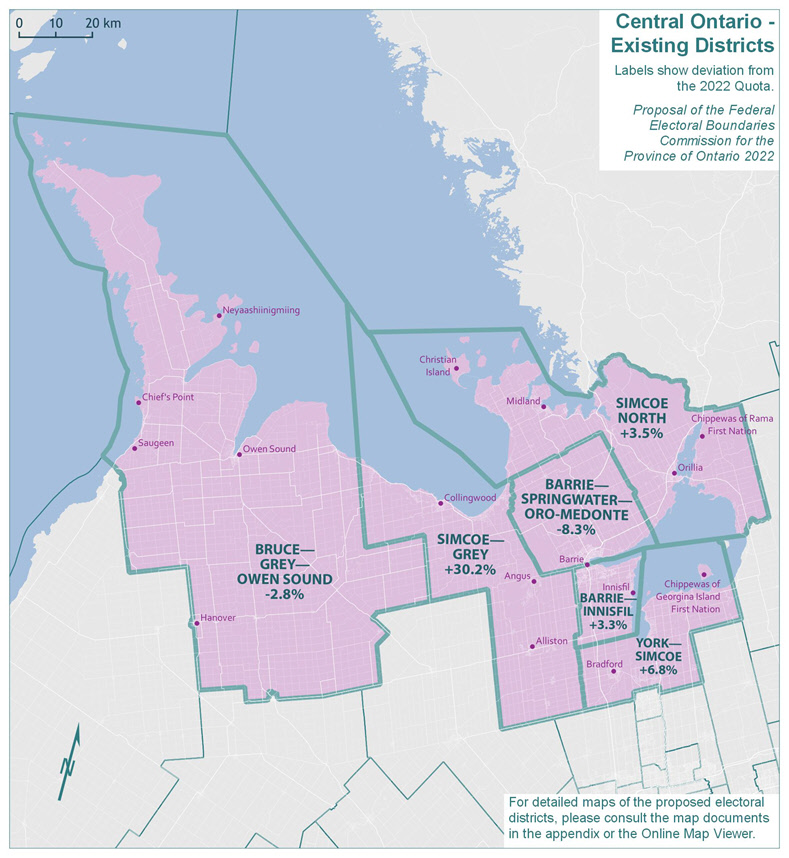
Text version of "Central Ontario Existing Districts"
Labels show deviation from the 2022 Quota.
Proposal of the Federal Electoral Boundaries Commission for the Province of Ontario 2022
For detailed maps of the proposed electoral districts, please consult the map documents in the appendix or the Online Map Viewer.
| Electoral district | Deviation |
|---|---|
| Barrie—Innisfil | 3.3% |
| Barrie—Springwater—Oro-Medonte | -8.3% |
| Bruce—Grey—Owen Sound | -2.8% |
| Simcoe North | 3.5% |
| Simcoe—Grey | 30.2% |
| York—Simcoe | 6.8% |
Central Ontario Proposed Districts
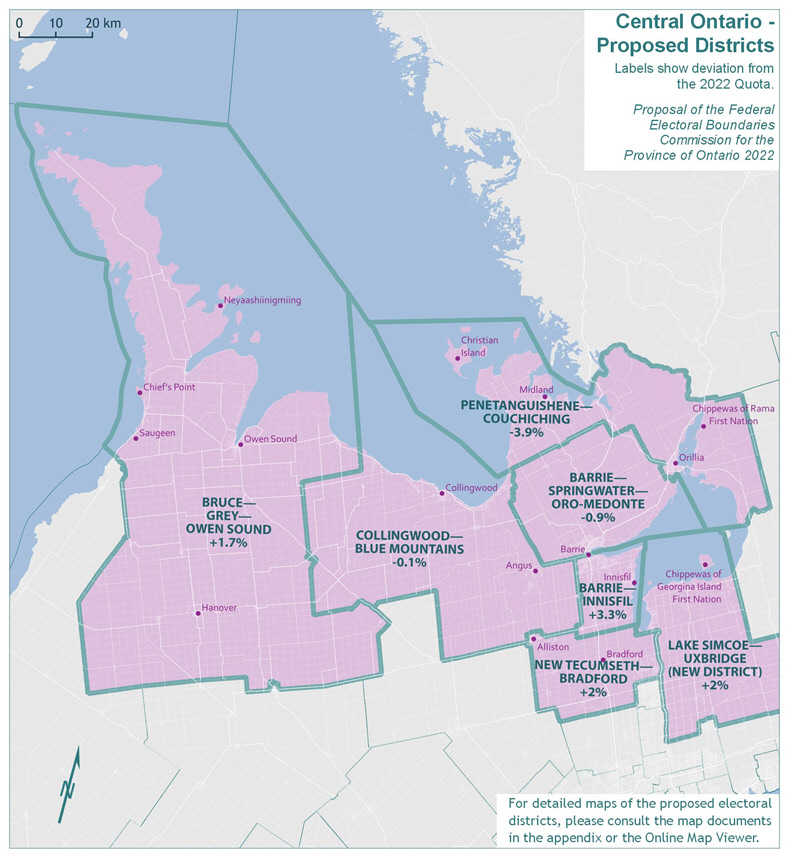
Text version of "Central Ontario Proposed Districts"
Labels show deviation from the 2022 Quota.
Proposal of the Federal Electoral Boundaries Commission for the Province of Ontario 2022
For detailed maps of the proposed electoral districts, please consult the map documents in the appendix or the Online Map Viewer.
| Electoral district | Deviation |
|---|---|
| Barrie—Innisfil | 3.3% |
| Barrie—Springwater—Oro-Medonte | -0.9% |
| Bruce—Grey—Owen Sound | 1.7% |
| Collingwood—Blue Mountains | -0.1% |
| Lake Simcoe—Uxbridge (New District) | 2.0% |
| New Tecumseth—Bradford | 2.0% |
| Penetanguishene—Couchiching | -3.9% |
The population of Central Ontario grew by 17.9%, from 625,530 in 2011 to 737,495 in 2021. The remainder of Ontario grew by 10.3% in the same period.
The existing six electoral districts in Central Ontario have an average 2021 population of 122,916 and fall 5.4% above the Quota. As indicated by the deviation range (38.5 percentage points), there are substantial disparities in the population size of districts. Simcoe—Grey has grown especially large, whereas other districts fall reasonably close to the 2022 Quota.
The populations and deviations from the Quota for the existing electoral districts are shown in Table 5A.
| Electoral Districts | Population ‒ 2011 | Deviation from Quota ‒ 2012 | Population ‒ 2021 | Deviation from Quota ‒ 2022 |
|---|---|---|---|---|
| Barrie—Innisfil | 101,584 | -4.36% | 120,378 | 3.25% |
| Barrie—Springwater—Oro-Medonte | 97,876 | -7.85% | 106,871 | -8.34% |
| Bruce—Grey—Owen Sound | 106,475 | 0.25% | 113,348 | -2.78% |
| Simcoe—Grey | 116,307 | 9.50% | 151,784 | 30.19% |
| Simcoe North | 108,672 | 2.31% | 120,656 | 3.49% |
| York—Simcoe | 94,616 | -10.92% | 124,458 | 6.75% |
| Average | 104,255 | -1.85% | 122,916 | 5.43% |
| Range (most populous to least populous) | 21,691 | 20.42 pp | 44,913 | 38.53 pp |
pp = percentage points
The proposed new district of Lake Simcoe—Uxbridge encompasses a portion of the existing district of York—Simcoe (as shown in the illustration above), plus portions of the existing districts of Markham—Stouffville (shown below in Northern GTA), and Pickering—Uxbridge and Durham (shown below in Eastern GTA).
In addition to the new district, boundaries are redrawn to balance the populations of the other six districts. In particular, the southern boundary of the existing district of Simcoe—Grey is shifted north and this district is renamed Collingwood—Blue Mountains. The growing community of New Tecumseth now falls in a newly named district, NEW Tecumseth—Bradford.
The new deviations from the Quota in the proposed redistribution plan are shown in Table 5B.
| Electoral Districts | Population ‒ 2021 | Deviation from Quota ‒ 2022 |
|---|---|---|
| Barrie—Innisfil | 120,378 | 3.25% |
| Barrie—Springwater—Oro-Medonte | 115,495 | -0.94% |
| Bruce—Grey—Owen Sound | 118,588 | 1.71% |
| Collingwood—Blue Mountains | 116,511 | -0.07% |
| Lake Simcoe—Uxbridge (New District) | 118,867 | 1.95% |
| New Tecumseth—Bradford | 118,958 | 2.03% |
| Penetanguishene—Couchiching | 112,022 | -3.92% |
| Average | 117,260 | 0.57% |
| Range (most populous to least populous) | 8,356 | 7.17 pp |
pp = percentage points
Northern Greater Toronto Area
Northern GTA Existing Districts
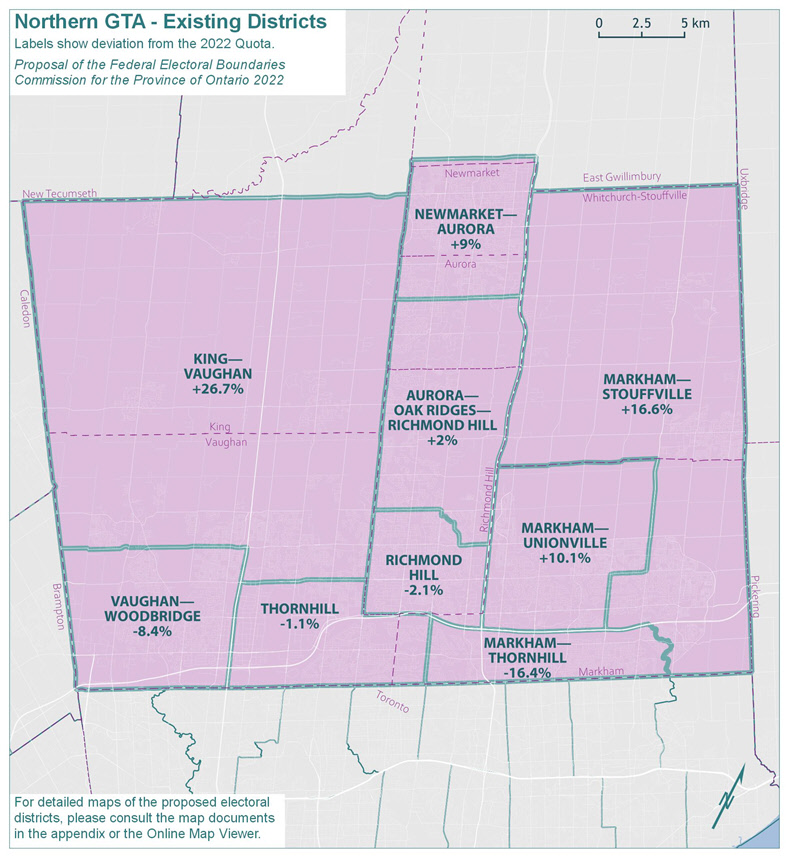
Text version of "Northern GTA Existing Districts"
Labels show deviation from the 2022 Quota.
Proposal of the Federal Electoral Boundaries Commission for the Province of Ontario 2022
For detailed maps of the proposed electoral districts, please consult the map documents in the appendix or the Online Map Viewer.
| Electoral district | Deviation |
|---|---|
| Aurora—Oak Ridges—Richmond Hill | 2.0% |
| King—Vaughan | 26.7% |
| Markham—Stouffville | 16.6% |
| Markham—Thornhill | -16.4% |
| Markham—Unionville | 10.1% |
| Newmarket—Aurora | 9.0% |
| Richmond Hill | -2.1% |
| Thornhill | -1.1% |
| Vaughan—Woodbridge | -8.4% |
Northern GTA Proposed Districts
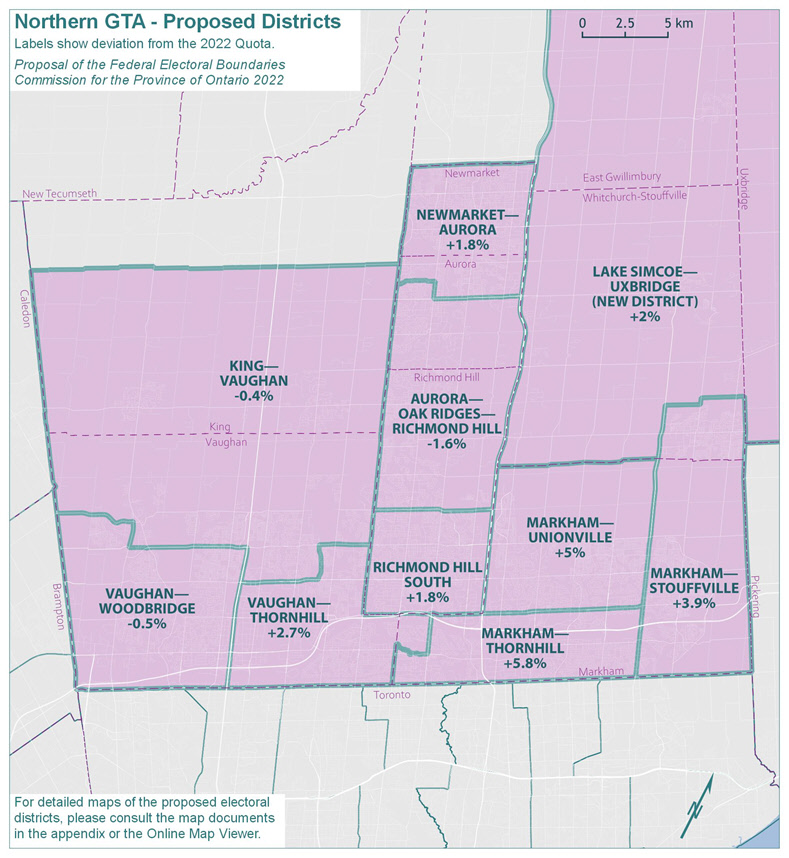
Text version of "Northern GTA Proposed Districts"
Labels show deviation from the 2022 Quota.
Proposal of the Federal Electoral Boundaries Commission for the Province of Ontario 2022
For detailed maps of the proposed electoral districts, please consult the map documents in the appendix or the Online Map Viewer.
| Electoral district | Deviation |
|---|---|
| Aurora—Oak Ridges—Richmond Hill | -1.6% |
| King—Vaughan | -0.4% |
| Lake Simcoe—Uxbridge (New District) | 2.0% |
| Markham—Stouffville | 3.9% |
| Markham—Thornhill | 5.8% |
| Markham—Unionville | 5.0% |
| Newmarket—Aurora | 1.8% |
| Richmond Hill South | 1.8% |
| Vaughan—Thornhill | 2.7% |
| Vaughan—Woodbridge | -0.5% |
The population of Northern GTA grew by 13%, from 965,985 in 2011 to 1,091,756 in 2021. The remainder of Ontario grew by 10.5% in the same period.
The existing nine electoral districts in Northern GTA would have an average 2021 population of 121,306 and an average deviation of 4% from the Quota. The range between the least and most populous districts would be 43.1 percentage points. As shown in Table 6A below, there are wide population disparities among the electoral districts within this geographic piece.
| Electoral Districts | Population ‒ 2011 | Deviation from Quota ‒ 2012 | Population ‒ 2021 | Deviation from Quota ‒ 2022 |
|---|---|---|---|---|
| Aurora—Oak Ridges—Richmond Hill | 106,064 | -0.14% | 118,883 | 1.97% |
| King—Vaughan | 109,235 | 2.84% | 147,695 | 26.68% |
| Markham—Stouffville | 109,780 | 3.36% | 135,944 | 16.60% |
| Markham—Thornhill | 102,221 | -3.76% | 97,510 | -16.37% |
| Markham—Unionville | 104,693 | -1.43% | 128,308 | 10.05% |
| Newmarket—Aurora | 109,457 | 3.05% | 127,134 | 9.04% |
| Richmond Hill | 108,658 | 2.30% | 114,180 | -2.07% |
| Thornhill | 110,427 | 3.97% | 115,292 | -1.11% |
| Vaughan—Woodbridge | 105,450 | -0.72% | 106,810 | -8.39% |
| Average | 107,332 | 1.05% | 121,306 | 4.04% |
| Range (most populous to least populous) | 8,206 | 7.73 pp | 50,185 | 43.05 pp |
pp = percentage points
The Commission noted that significant changes are required to ensure voter parity as much as reasonably possible. As shown in the illustrations, the new district of Lake Simcoe—Uxbridge encompasses all of the northern portion of the current Markham—Stouffville district. In the southeast corner of this geographic piece, the boundaries of the adjacent districts of Markham—Stouffville, Markham—Thornhill and Markham—Unionville are adjusted to bring those districts closer to population parity. Adjustments are also proposed to address the fast-growing population in the existing district of King—Vaughan. The boundary between King—Vaughan and Vaughan—Woodbridge is shifted northward to balance the populations of these adjacent ridings.
The new deviations from the Quota in the proposed redistribution plan are shown in Table 6B.
| Electoral Districts | Population ‒ 2021 | Deviation from Quota ‒ 2022 |
|---|---|---|
| Aurora—Oak Ridges—Richmond Hill | 114,676 | -1.64% |
| King—Vaughan | 116,118 | -0.40% |
| Lake Simcoe—Uxbridge (New District) | 118,867 | 1.95% |
| Markham—Stouffville | 121,176 | 3.93% |
| Markham—Thornhill | 123,400 | 5.84% |
| Markham—Unionville | 122,401 | 4.98% |
| Newmarket—Aurora | 118,666 | 1.78% |
| Richmond Hill South | 118,679 | 1.79% |
| Vaughan—Thornhill | 119,771 | 2.73% |
| Vaughan—Woodbridge | 115,957 | -0.54% |
| Average | 118,971 | 2.04% |
| Range (most populous to least populous) | 8,724 | 7.48 pp |
pp = percentage points
Eastern Greater Toronto Area
Eastern GTA Existing Districts
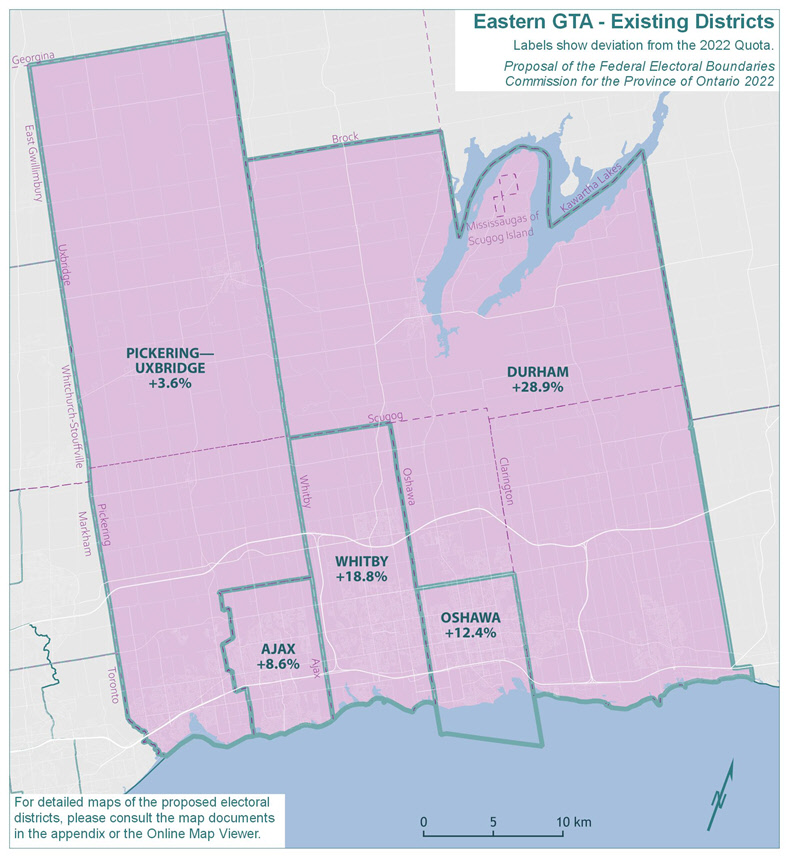
Text version of "Eastern GTA Existing Districts"
Labels show deviation from the 2022 Quota.
Proposal of the Federal Electoral Boundaries Commission for the Province of Ontario 2022
For detailed maps of the proposed electoral districts, please consult the map documents in the appendix or the Online Map Viewer.
| Electoral district | Deviation |
|---|---|
| Ajax | 8.6% |
| Durham | 28.9% |
| Oshawa | 12.4% |
| Pickering—Uxbridge | 3.6% |
| Whitby | 18.8% |
Eastern GTA Proposed Districts
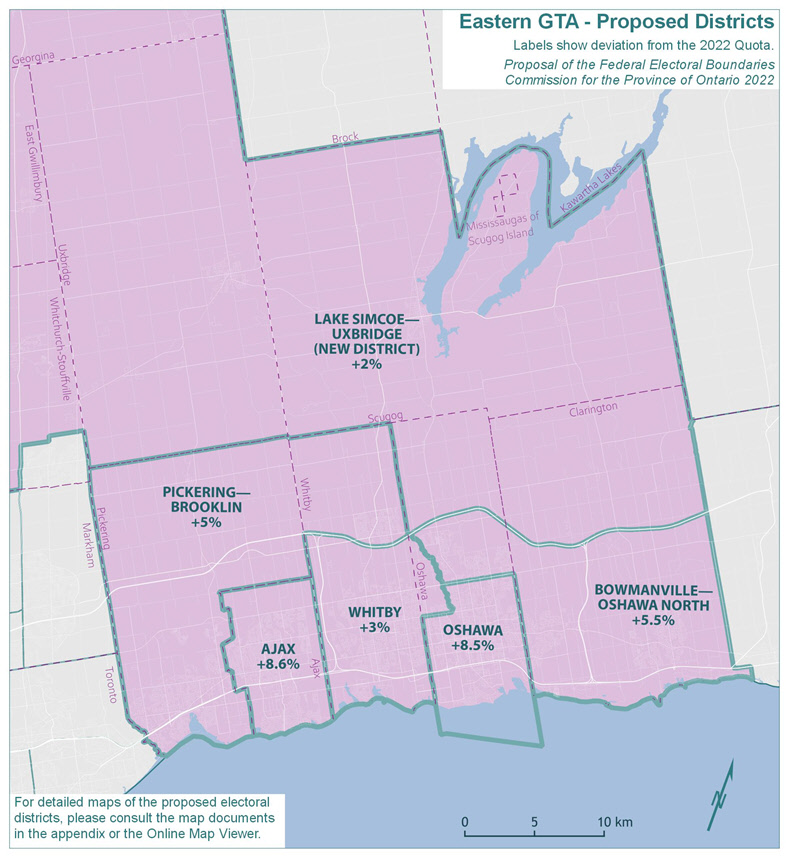
Text version of "Eastern GTA Proposed Districts"
Proposal of the Federal Electoral Boundaries Commission for the Province of Ontario 2022
For detailed maps of the proposed electoral districts, please consult the map documents in the appendix or the Online Map Viewer.
| Electoral district | Deviation |
|---|---|
| Ajax | 8.6% |
| Bowmanville—Oshawa North | 5.5% |
| Lake Simcoe—Uxbridge (New District) | 2.0% |
| Oshawa | 8.5% |
| Pickering—Brooklin | 5.0% |
| Whitby | 3.0% |
The population of Eastern GTA grew by 14.6%, from 582,132 in 2011 to 667,211 in 2021. The remainder of Ontario grew by 10.5% in the same period.
The existing five electoral districts in Eastern GTA would have an average 2021 population of 133,442 and an average deviation of 14.5% from the Quota. The absolute range between the least and most populous districts would be 25.3 percentage points. The populations and deviations from the Quota for the existing electoral districts are shown in Table 7A.
| Electoral Districts | Population ‒ 2011 | Deviation from Quota ‒ 2012 | Population ‒ 2021 | Deviation from Quota ‒ 2022 |
|---|---|---|---|---|
| Ajax | 109,600 | 3.19% | 126,666 | 8.64% |
| Durham | 115,395 | 8.64% | 150,235 | 28.86% |
| Oshawa | 125,771 | 18.41% | 131,067 | 12.42% |
| Pickering—Uxbridge | 109,344 | 2.95% | 120,742 | 3.56% |
| Whitby | 122,022 | 14.88% | 138,501 | 18.79% |
| Average | 116,426 | 9.61% | 133,442 | 14.45% |
| Range (most populous to least populous) | 16,427 | 15.46 pp | 29,493 | 25.30 pp |
pp = percentage points
Population growth over the past decade in the Durham Region necessitates a number of significant boundary adjustments in this geographic piece.
The new district of Lake Simcoe—Uxbridge, as seen in the illustration, incorporates the northern portions of the existing districts of Pickering—Uxbridge and Durham. As a result of this change and of population growth in the City of Whitby (and the community of Brooklin in particular), the Commission proposes to place Brooklin in the district of Pickering—Brooklin. The area constituting the southern portion of the current district of Durham is renamed Bowmanville—Oshawa North.
The adjusted districts Oshawa and Whitby are now more compact in size, with populations much closer to the Quota. The boundaries of Ajax are unchanged.
| Electoral Districts | Population ‒ 2021 | Deviation from Quota ‒ 2022 |
|---|---|---|
| Ajax | 126,666 | 8.64% |
| Bowmanville—Oshawa North | 123,036 | 5.53% |
| Lake Simcoe—Uxbridge (New District) | 118,867 | 1.95% |
| Oshawa | 126,499 | 8.50% |
| Pickering—Brooklin | 122,430 | 5.01% |
| Whitby | 120,078 | 2.99% |
| Average | 122,929 | 5.44% |
| Range (most populous to least populous) | 7,799 | 6.69 pp |
pp = percentage points