
Details of the Proposed Redistribution Plan – Part B – Geographic Pieces in the Balance of the Province, from East to West – Ontario
Eastern Ontario
Eastern Ontario Existing Districts
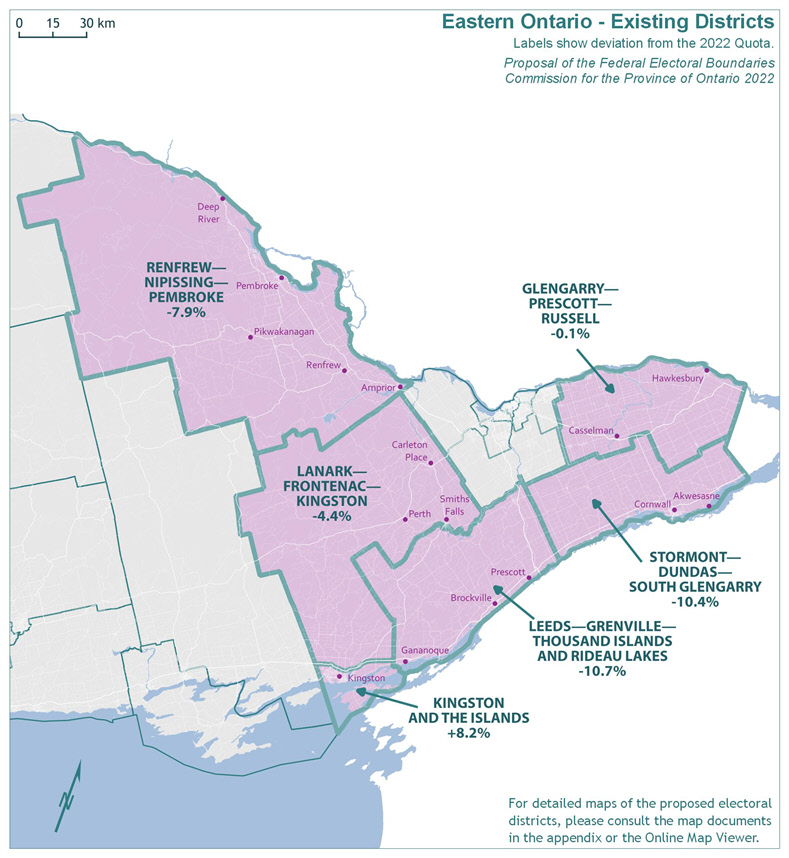
Text version of "Eastern Ontario Existing Districts"
Labels show deviation from the 2022 Quota.
Proposal of the Federal Electoral Boundaries Commission for the Province of Ontario 2022
For detailed maps of the proposed electoral districts, please consult the map documents in the appendix or the Online Map Viewer.
| Electoral district | Deviation |
|---|---|
| Glengarry—Prescott—Russell | -0.1% |
| Kingston and the Islands | 8.2% |
| Lanark—Frontenac—Kingston | -4.4% |
| Leeds—Grenville—Thousand Islands and Rideau Lakes | -10.7% |
| Renfrew—Nipissing—Pembroke | -7.9% |
| Stormont—Dundas—South Glengarry | -10.4% |
Eastern Ontario Proposed Districts
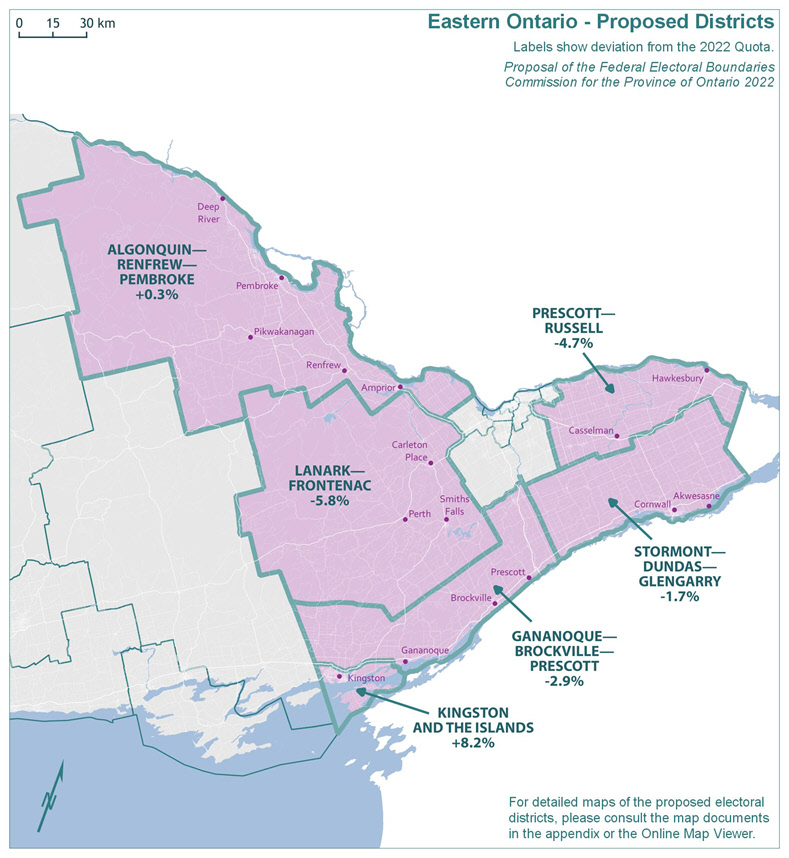
Text version of "Eastern Ontario Proposed Districts"
Labels show deviation from the 2022 Quota.
Proposal of the Federal Electoral Boundaries Commission for the Province of Ontario 2022
For detailed maps of the proposed electoral districts, please consult the map documents in the appendix or the Online Map Viewer.
| Electoral district | Deviation |
|---|---|
| Algonquin—Renfrew—Pembroke | 0.3% |
| Gananoque—Brockville—Prescott | -2.9% |
| Kingston and the Islands | 8.2% |
| Lanark—Frontenac | -5.8% |
| Prescott—Russell | -4.7% |
| Stormont—Dundas—Glengarry | -1.7% |
The population of Eastern Ontario grew by 7.3%, from 624,416 in 2011 to 669,976 in 2021. The remainder of Ontario grew by 10.8% in the same period.
The existing six electoral districts in Eastern Ontario would have an average 2021 population of 111,663 and an average deviation of -4.2% from the Quota. The absolute range between the least and most populous districts would be 18.9 percentage points. The populations and deviations from the Quota for the existing electoral districts are shown in Table 8A.
| Electoral Districts | Population ‒ 2011 | Deviation from Quota ‒ 2012 | Population ‒ 2021 | Deviation from Quota ‒ 2022 |
|---|---|---|---|---|
| Glengarry—Prescott—Russell | 106,240 | 0.02% | 116,463 | -0.11% |
| Kingston and the Islands | 116,996 | 10.15% | 126,106 | 8.16% |
| Lanark—Frontenac—Kingston | 98,424 | -7.33% | 111,424 | -4.43% |
| Leeds—Grenville—Thousand Islands and Rideau Lakes | 99,306 | -6.50% | 104,070 | -10.74% |
| Renfrew—Nipissing—Pembroke | 102,537 | -3.46% | 107,420 | -7.87% |
| Stormont—Dundas—South Glengarry | 100,913 | -4.99% | 104,493 | -10.38% |
| Average | 104,069 | -2.02% | 111,663 | -4.23% |
| Range (most populous to least populous) | 18,572 | 17.48 pp | 22,036 | 18.90 pp |
pp = percentage points
Proposed changes to boundaries in this geographic piece result from the goal of achieving population equality; however, these changes are relatively minor in comparison with those of other parts of the province. The Commission endeavoured to maintain districts of manageable size and respect communities of interest.
The majority representation of the Francophone community in the existing district of Glengarry—Prescott—Russell is maintained in the proposed district of Prescott—Russell.
The new deviations from the Quota in the proposed redistribution plan are shown in Table 8B.
| Electoral Districts | Population ‒ 2021 | Deviation from Quota ‒ 2022 |
|---|---|---|
| Algonquin—Renfrew—Pembroke | 116,900 | 0.27% |
| Gananoque—Brockville—Prescott | 113,266 | -2.85% |
| Kingston and the Islands | 126,106 | 8.16% |
| Lanark—Frontenac | 109,784 | -5.84% |
| Prescott—Russell | 111,163 | -4.65% |
| Stormont—Dundas—Glengarry | 114,637 | -1.68% |
| Average | 115,309 | -1.10% |
| Range (most populous to least populous) | 16,322 | 14.00 pp |
pp = percentage points
Ottawa
Ottawa Existing Districts
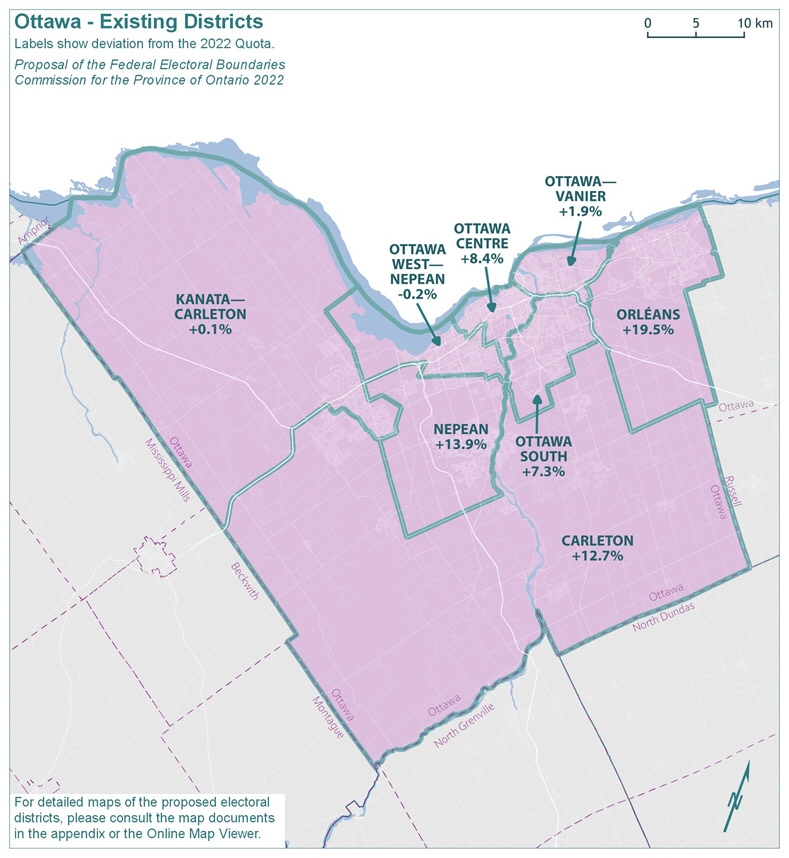
Text version of "Ottawa Existing Districts"
Labels show deviation from the 2022 Quota.
Proposal of the Federal Electoral Boundaries Commission for the Province of Ontario 2022
For detailed maps of the proposed electoral districts, please consult the map documents in the appendix or the Online Map Viewer.
| Electoral district | Deviation |
|---|---|
| Carleton | 12.7% |
| Kanata—Carleton | 0.1% |
| Nepean | 13.9% |
| Orleans | 19.5% |
| Ottawa Centre | 8.4% |
| Ottawa South | 7.3% |
| Ottawa West—Nepean | -0.2% |
| Ottawa—Vanier | 1.9% |
Ottawa Proposed Districts
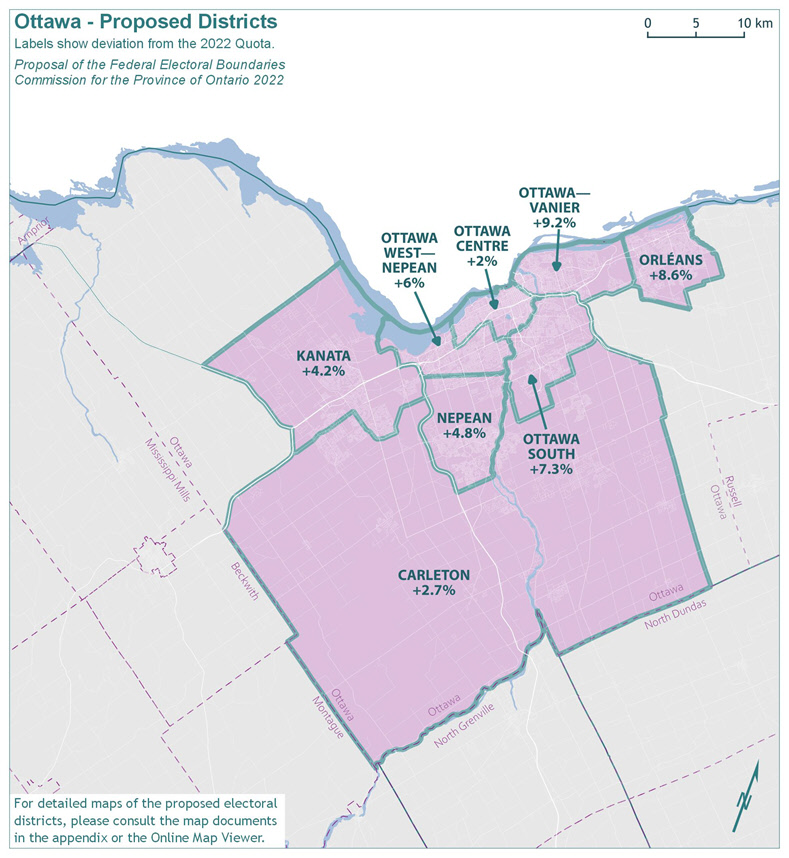
Text version of "Ottawa Proposed Districts"
Labels show deviation from the 2022 Quota.
Proposal of the Federal Electoral Boundaries Commission for the Province of Ontario 2022
For detailed maps of the proposed electoral districts, please consult the map documents in the appendix or the Online Map Viewer.
| Electoral district | Deviation |
|---|---|
| Carleton | 2.7% |
| Kanata | 4.2% |
| Nepean | 4.8% |
| Orléans | 8.6% |
| Ottawa Centre | 2.0% |
| Ottawa South | 7.3% |
| Ottawa—Vanier | 9.2% |
| Ottawa West—Nepean | 6.0% |
The population of the Ottawa geographic piece grew by 15.4%, from 872,783 in 2011 to 1,006,769 in 2021. The remainder of Ontario grew by 10.3% in the same period.
The existing eight electoral districts in the Ottawa geographic piece would have an average 2021 population of 125,846 and an average deviation of 7.9% from the Quota. The absolute range between the least and most populous districts would be 19.7 percentage points. The populations and deviations from the Quota for the existing electoral districts are shown in Table 9A.
| Electoral Districts | Population ‒ 2011 | Deviation from Quota ‒ 2012 | Population ‒ 2021 | Deviation from Quota ‒ 2022 |
|---|---|---|---|---|
| Carleton | 89,522 | -15.72% | 131,375 | 12.68% |
| Kanata—Carleton | 100,846 | -5.05% | 116,651 | 0.05% |
| Nepean | 104,775 | -1.35% | 132,769 | 13.88% |
| Orléans | 119,247 | 12.27% | 139,309 | 19.49% |
| Ottawa Centre | 113,619 | 6.97% | 126,360 | 8.38% |
| Ottawa South | 121,894 | 14.76% | 125,090 | 7.29% |
| Ottawa—Vanier | 110,999 | 4.51% | 118,806 | 1.90% |
| Ottawa West—Nepean | 111,881 | 5.34% | 116,409 | -0.16% |
| Average | 109,098 | 2.72% | 125,846 | 7.94% |
| Range (most populous to least populous) | 32,372 | 30.48 pp | 22,900 | 19.65 pp |
pp = percentage points
Significant redrawing was required, given the large deviations from the Quota in the suburban area comprised of the existing districts of Carleton, Nepean, and Orléans. The Commission noted that these three districts are underrepresented with populations that are, respectively, 12.7%, 13.9% and 19.5% above the Quota. The proposed boundary changes bring these districts closer to the Quota.
The most notable change concerns Orléans, where an adjustment to the southern boundary, pushing it up towards the Ottawa River, will bring its population much closer to parity with surrounding districts.
Population growth in the existing districts of Nepean and Carleton necessitates further boundary changes that in turn impact the existing district of Kanata—Carleton. The Commission proposes shifting the boundaries of the proposed district of Kanata to the east to address these disparities.
The Commission has endeavoured to respect the interests of the Francophone community by ensuring that their representation in the proposed districts of Orléans, Ottawa—Vanier and Ottawa South are not diluted.
The new deviations from the Quota in the proposed redistribution plan are shown in Table 9B.
| Electoral Districts | Population ‒ 2021 | Deviation from Quota ‒ 2022 |
|---|---|---|
| Carleton | 119,737 | 2.70% |
| Kanata | 121,458 | 4.18% |
| Nepean | 122,229 | 4.84% |
| Orléans | 126,662 | 8.64% |
| Ottawa Centre | 118,950 | 2.02% |
| Ottawa South | 125,075 | 7.28% |
| Ottawa—Vanier | 127,255 | 9.15% |
| Ottawa West—Nepean | 123,533 | 5.96% |
| Average | 123,112 | 5.60% |
| Range (most populous to least populous) | 8,305 | 7.13 pp |
pp = percentage points
Central East Ontario
Central East Ontario Existing Districts
Text version of "Central East Ontario Existing Districts"
Labels show deviation from the 2022 Quota.
Proposal of the Federal Electoral Boundaries Commission for the Province of Ontario 2022
For detailed maps of the proposed electoral districts, please consult the map documents in the appendix or the Online Map Viewer.
| Electoral district | Deviation |
|---|---|
| Bay of Quinte | -0.5% |
| Haliburton—Kawartha Lakes—Brock | 5.0% |
| Hastings—Lennox and Addington | -13.7% |
| Northumberland—Peterborough South | 1.9% |
| Peterborough—Kawartha | 7.6% |
Central East Ontario Proposed Districts
Text version of "Central East Ontario Proposed Districts"
Labels show deviation from the 2022 Quota.
Proposal of the Federal Electoral Boundaries Commission for the Province of Ontario 2022
For detailed maps of the proposed electoral districts, please consult the map documents in the appendix or the Online Map Viewer.
| Electoral district | Deviation |
|---|---|
| Bay of Quinte | -0.5% |
| Haliburton—Kawartha Lakes—Brock | 3.1% |
| Hastings—Lennox and Addington—Tyendinaga | -4.5% |
| Northumberland | -1.9% |
| Peterborough | 4.1% |
The population of Central East Ontario grew by 9%, from 535,322 in 2011 to 583,287 in 2021. The remainder of Ontario grew by 10.8% in the same period.
The existing five electoral districts in Central East Ontario would have an average 2021 population of 116,657 and an average deviation of 0.1% from the Quota. The absolute range between the least and most populous districts would be 21.3 percentage points. The populations and deviations from the Quota for the existing electoral districts are shown in Table 10A.
| Electoral Districts | Population ‒ 2011 | Deviation from Quota ‒ 2012 | Population ‒ 2021 | Deviation from Quota ‒ 2022 |
|---|---|---|---|---|
| Bay of Quinte | 109,488 | 3.08% | 116,016 | -0.49% |
| Haliburton—Kawartha Lakes—Brock | 110,217 | 3.77% | 122,401 | 4.98% |
| Hastings—Lennox and Addington | 92,513 | -12.90% | 100,636 | -13.68% |
| Northumberland—Peterborough South | 107,840 | 1.53% | 118,756 | 1.86% |
| Peterborough—Kawartha | 115,264 | 8.52% | 125,478 | 7.62% |
| Average | 107,064 | 0.80% | 116,657 | 0.06% |
| Range (most populous to least populous) | 22,751 | 21.42 pp | 24,842 | 21.30 pp |
pp = percentage points
The Commission shifted boundaries to balance the population of the districts across this geographic piece. This affects most significantly the existing district of Hastings—Lennox and Addington.
The Commission also proposes shifting the boundaries of the existing district of Peterborough—Kawartha southward to ensure that the reserves of the Alderville First Nation lie within the same district and to recognize the established connection of the Township of Otonabee-South Monaghan with Peterborough. This district is renamed as Peterborough.
The new deviations from the Quota in the proposed redistribution plan are shown in Table 10B.
| Electoral Districts | Population ‒ 2021 | Deviation from Quota ‒ 2022 |
|---|---|---|
| Bay of Quinte | 116,016 | -0.49% |
| Haliburton—Kawartha Lakes—Brock | 120,254 | 3.14% |
| Hastings—Lennox and Addington—Tyendinaga | 111,331 | -4.51% |
| Northumberland | 114,335 | -1.93% |
| Peterborough | 121,336 | 4.07% |
| Average | 116,654 | 0.06% |
| Range (most populous to least populous) | 10,005 | 8.58 pp |
pp = percentage points
Mississauga
Mississauga Existing Districts
Text version of "Mississauga Existing Districts"
Labels show deviation from the 2022 Quota.
Proposal of the Federal Electoral Boundaries Commission for the Province of Ontario 2022
For detailed maps of the proposed electoral districts, please consult the map documents in the appendix or the Online Map Viewer.
| Electoral district | Deviation |
|---|---|
| Mississauga Centre | 9.3% |
| Mississauga East—Cooksville | -0.2% |
| Mississauga—Erin Mills | 5.8% |
| Mississauga—Lakeshore | 0.4% |
| Mississauga—Malton | 0.3% |
| Mississauga—Streetsville | 0.2% |
Mississauga Proposed Districts
Text version of "Mississauga Proposed Districts"
Labels show deviation from the 2022 Quota.
Proposal of the Federal Electoral Boundaries Commission for the Province of Ontario 2022
For detailed maps of the proposed electoral districts, please consult the map documents in the appendix or the Online Map Viewer.
| Electoral district | Deviation |
|---|---|
| Mississauga Centre | 2.9% |
| Mississauga—Erin Mills | 2.5% |
| Mississauga East—Cooksville | 3.1% |
| Mississauga Lakeshore | 2.9% |
| Mississauga—Malton | 2.7% |
| Mississauga—Meadowvale | 1.7% |
The population of Mississauga has remained relatively constant, with population growth of 0.6%, from 713,443 in 2011 to 717,961 in 2021. The remainder of Ontario grew by 11.3% in the same period.
The existing six electoral districts in Mississauga would have an average 2021 population of 119,660 and an average deviation of 2.6% from the Quota. The absolute range between the least and most populous districts would be 9.5 percentage points. The populations and deviations from the Quota for the existing electoral districts are shown in Table 11A.
| Electoral Districts | Population ‒ 2011 | Deviation from Quota ‒ 2012 | Population ‒ 2021 | Deviation from Quota ‒ 2022 |
|---|---|---|---|---|
| Mississauga Centre | 118,756 | 11.81% | 127,377 | 9.25% |
| Mississauga East—Cooksville | 121,792 | 14.67% | 116,346 | -0.21% |
| Mississauga—Erin Mills | 117,199 | 10.34% | 123,371 | 5.82% |
| Mississauga—Lakeshore | 118,893 | 11.94% | 117,095 | 0.43% |
| Mississauga—Malton | 118,046 | 11.14% | 116,908 | 0.27% |
| Mississauga—Streetsville | 118,757 | 11.81% | 116,864 | 0.24% |
| Average | 118,907 | 11.95% | 119,660 | 2.63% |
| Range (most populous to least populous) | 4,593 | 4.33 pp | 11,031 | 9.46 pp |
pp = percentage points
The Commission proposes minor boundary adjustments to balance the populations of the six existing districts in Mississauga. These districts remain within the municipal boundaries of the City of Mississauga, and their boundaries align with major roads, the Credit River, and the Canadian Pacific rail line.
The new deviations from the Quota in the proposed redistribution plan are shown in Table 11B.
| Electoral Districts | Population ‒ 2021 | Deviation from Quota ‒ 2022 |
|---|---|---|
| Mississauga Centre | 119,975 | 2.90% |
| Mississauga East—Cooksville | 120,196 | 3.09% |
| Missisauga—Erin Mills | 119,526 | 2.52% |
| Mississauga Lakeshore | 119,936 | 2.87% |
| Mississauga—Malton | 119,741 | 2.70% |
| Mississauga—Meadowvale | 118,587 | 1.71% |
| Average | 119,660 | 2.63% |
| Range (most populous to least populous) | 1,609 | 1.38 pp |
pp = percentage points
Hamilton and Niagara
Hamilton and Niagara Existing Districts
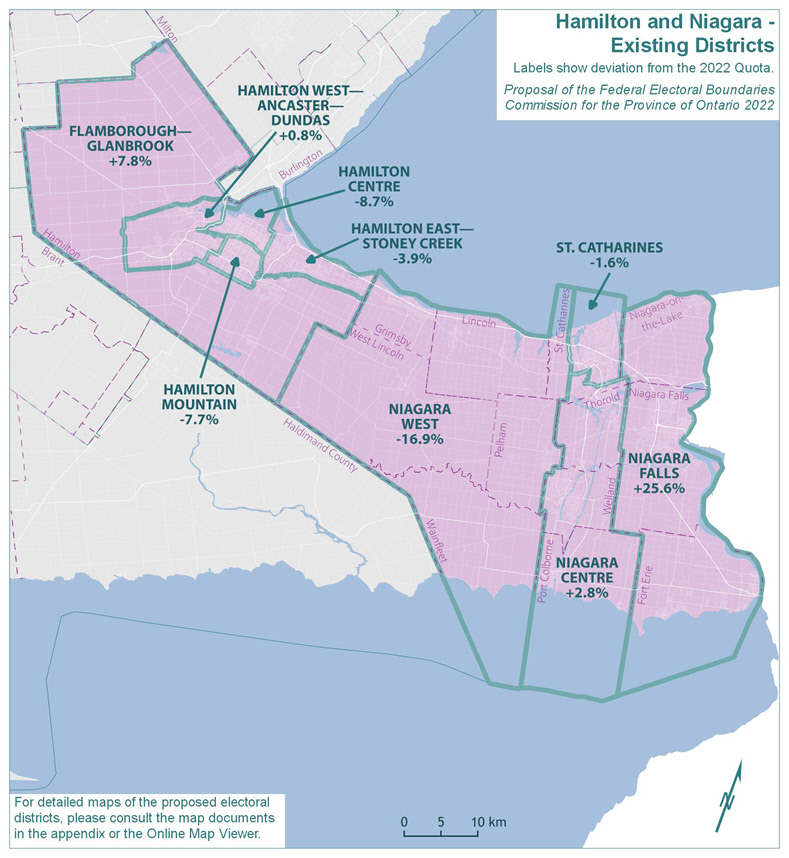
Text version of "Hamilton and Niagara Existing Districts"
Labels show deviation from the 2022 Quota.
Proposal of the Federal Electoral Boundaries Commission for the Province of Ontario 2022
For detailed maps of the proposed electoral districts, please consult the map documents in the appendix or the Online Map Viewer.
| Electoral district | Deviation |
|---|---|
| Flamborough—Glanbrook | 7.8% |
| Hamilton Centre | -8.7% |
| Hamilton East—Stoney Creek | -3.9% |
| Hamilton Mountain | -7.7% |
| Hamilton West—Ancaster—Dundas | 0.8% |
| Niagara Centre | 2.8% |
| Niagara Falls | 25.6% |
| Niagara West | -16.9% |
| St. Catharines | -1.6% |
Hamilton and Niagara Proposed Districts
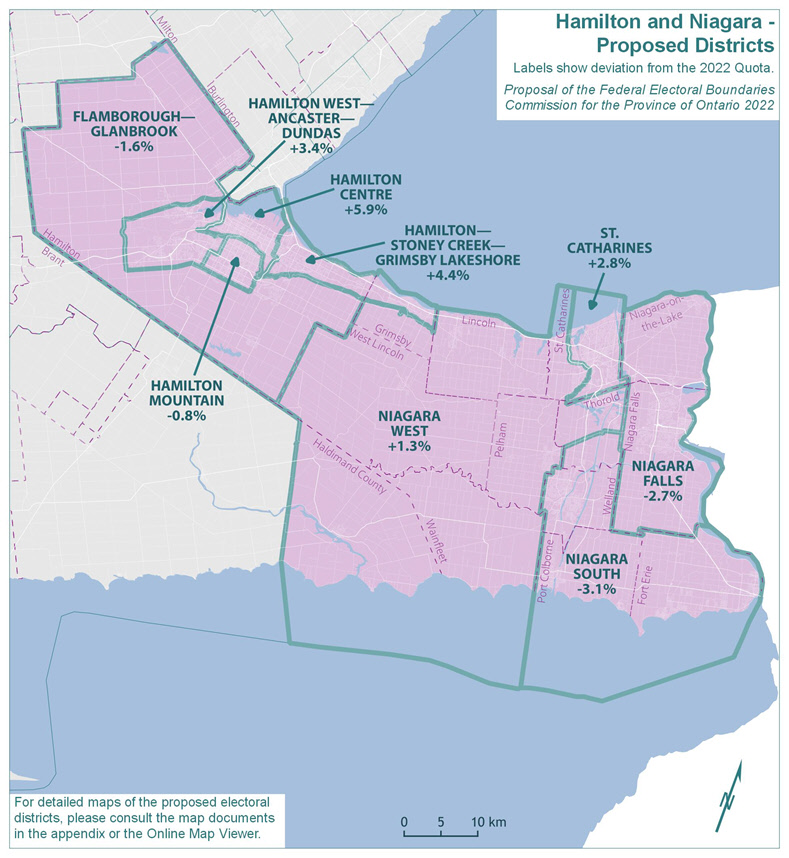
Text version of "Hamilton and Niagara Proposed Districts"
Labels show deviation from the 2022 Quota.
Proposal of the Federal Electoral Boundaries Commission for the Province of Ontario 2022
For detailed maps of the proposed electoral districts, please consult the map documents in the appendix or the Online Map Viewer.
| Electoral district | Deviation |
|---|---|
| Flamborough—Glanbrook | -1.6% |
| Hamilton Centre | 5.9% |
| Hamilton Mountain | -0.8% |
| Hamilton—Stoney Creek—Grimsby Lakeshore | 4.4% |
| Hamilton West—Ancaster—Dundas | 3.4% |
| Niagara Falls | -2.7% |
| Niagara South | -3.1% |
| Niagara West | 1.3% |
| St. Catharines | 2.8% |
The population of Hamilton and Niagara grew by 10.1%, from 951,295 in 2011 to 1,047,294 in 2021. The remainder of Ontario grew by 10.7% in the same period.
The existing nine electoral districts in this geographic piece would have an average 2021 population of 116,366, which falls just 0.2% below the Quota. However, the Commission noted the unacceptably high range of deviation (42.4 percentage points) between the least and most populous districts. The populations and deviations from the Quota for the existing districts are shown in Table 12A.
| Electoral Districts | Population ‒ 2011 | Deviation from Quota ‒ 2012 | Population ‒ 2021 | Deviation from Quota ‒ 2022 |
|---|---|---|---|---|
| Flamborough—Glanbrook | 97,081 | -8.60% | 125,692 | 7.81% |
| Hamilton Centre | 101,932 | -4.03% | 106,439 | -8.71% |
| Hamilton East—Stoney Creek | 107,786 | 1.48% | 112,028 | -3.91% |
| Hamilton Mountain | 103,615 | -2.45% | 107,629 | -7.69% |
| Hamilton West—Ancaster—Dundas | 109,535 | 3.13% | 117,565 | 0.84% |
| Niagara Centre | 105,860 | -0.33% | 119,809 | 2.76% |
| Niagara Falls | 128,357 | 20.85% | 146,404 | 25.57% |
| Niagara West | 86,533 | -18.53% | 96,946 | -16.85% |
| St. Catharines | 110,596 | 4.13% | 114,782 | -1.55% |
| Average | 105,699 | -0.48% | 116,366 | -0.19% |
| Range (most populous to least populous) | 41,824 | 39.38 pp | 49,458 | 42.42 pp |
pp = percentage points
Within the Niagara Peninsula, the Commission noted unreasonable variations in the population size of the existing districts of Niagara Falls and Niagara West. Significant adjustments were required to achieve population equality, with resulting impacts on contiguous areas.
In the Hamilton area, the Commission made minor boundary adjustments to achieve voter parity. One resulting change was the inclusion of the urban portions of the Municipality of Grimsby within the newly named district of Hamilton—Stoney Creek—Grimsby Lakeshore. This is a consequence of changes that were necessary in the Niagara area.
The new deviations from the Quota in the proposed redistribution plan are shown in Table 12B.
| Electoral Districts | Population ‒ 2021 | Deviation from Quota ‒ 2022 |
|---|---|---|
| Flamborough—Glanbrook | 114,701 | -1.62% |
| Hamilton Centre | 123,520 | 5.94% |
| Hamilton Mountain | 115,634 | -0.82% |
| Hamilton—Stoney Creek—Grimsby Lakeshore | 121,709 | 4.39% |
| Hamilton West—Ancaster—Dundas | 120,551 | 3.40% |
| Niagara Falls | 113,503 | -2.65% |
| Niagara South | 112,928 | -3.14% |
| Niagara West | 118,158 | 1.34% |
| St. Catharines | 119,873 | 2.82% |
| Average | 117,842 | 1.07% |
| Range (most populous to least populous) | 10,592 | 9.08 pp |
pp = percentage points
South Central Ontario
South Central Ontario Existing Districts
Text version of "South Central Ontario Existing Districts"
Labels show deviation from the 2022 Quota.
Proposal of the Federal Electoral Boundaries Commission for the Province of Ontario 2022
For detailed maps of the proposed electoral districts, please consult the map documents in the appendix or the Online Map Viewer.
| Electoral district | Deviation |
|---|---|
| Brantford—Brant | 20.2% |
| Cambridge | 4.0% |
| Haldimand—Norfolk | 0.1% |
| Kitchener Centre | -2.7% |
| Kitchener South—Hespeler | 2.8% |
| Kitchener—Conestoga | -8.1% |
| Oxford | 7.0% |
| Waterloo | 9.1% |
South Central Ontario Proposed Districts
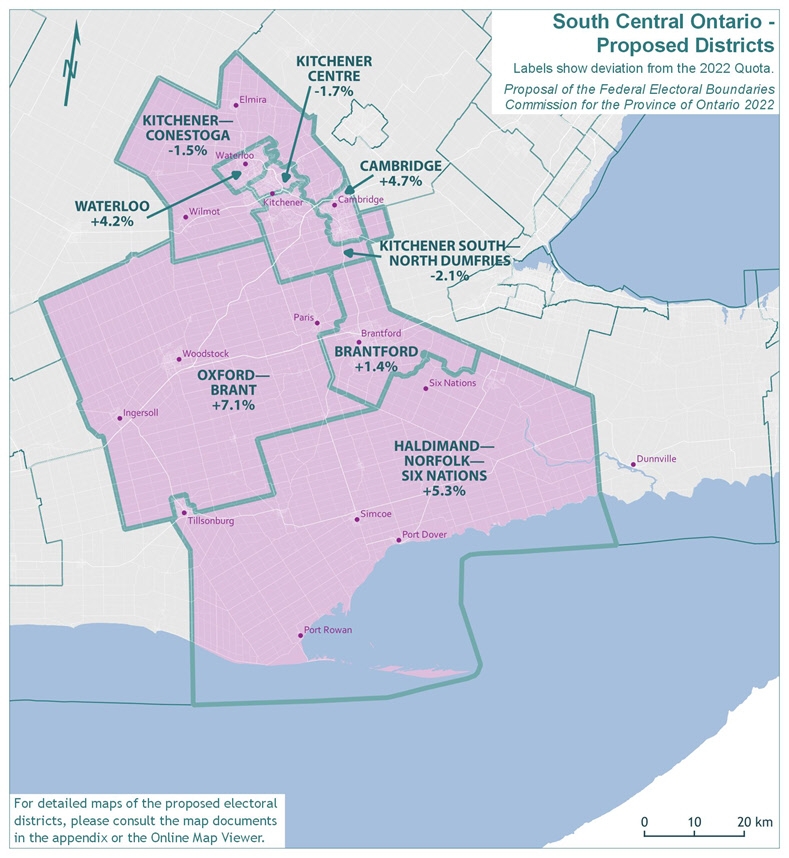
Text version of "South Central Ontario Proposed Districts"
Labels show deviation from the 2022 Quota.
Proposal of the Federal Electoral Boundaries Commission for the Province of Ontario 2022
For detailed maps of the proposed electoral districts, please consult the map documents in the appendix or the Online Map Viewer.
| Electoral district | Deviation |
|---|---|
| Brantford | 1.4% |
| Cambridge | 4.7% |
| Haldimand—Norfolk—Six Nations | 5.3% |
| Kitchener Centre | -1.7% |
| Kitchener—Conestoga | -1.5% |
| Kitchener South—North Dumfries | -2.1% |
| Oxford—Brant | 7.1% |
| Waterloo | 4.2% |
The population of South Central Ontario grew by 13.1%, from 857,968 in 2011 to 970,608 in 2021. The remainder of Ontario grew by 10.5% in the same period.
The existing eight electoral districts in South Central Ontario would have an average 2021 population of 121,326 and an average deviation of 4.1% from the Quota. The absolute range between the least and most populous districts would be 28.3 percentage points. The populations and deviations from the Quota for the existing electoral districts are shown in Table 13A.
| Electoral Districts | Population ‒ 2011 | Deviation from Quota ‒ 2012 | Population ‒ 2021 | Deviation from Quota ‒ 2022 |
|---|---|---|---|---|
| Brantford—Brant | 132,443 | 24.69% | 140,139 | 20.20% |
| Cambridge | 111,693 | 5.16% | 121,301 | 4.04% |
| Haldimand—Norfolk | 108,051 | 1.73% | 116,706 | 0.10% |
| Kitchener Centre | 102,433 | -3.56% | 113,452 | -2.69% |
| Kitchener—Conestoga | 93,827 | -11.66% | 107,134 | -8.11% |
| Kitchener South—Hespeler | 97,673 | -8.04% | 119,851 | 2.80% |
| Oxford | 108,656 | 2.30% | 124,790 | 7.03% |
| Waterloo | 103,192 | -2.85% | 127,235 | 9.13% |
| Average | 107,246 | 0.97% | 121,326 | 4.06% |
| Range (most populous to least populous) | 38,616 | 36.35 pp | 33,005 | 28.31 pp |
pp = percentage points
The Commission noted the significant deviation from the Quota in the prior redistribution in the existing district of Brantford—Brant. To address this, the Commission has reduced the geographic size of this district and proposed it be renamed Brantford.
As a result, several communities have been re-assigned to surrounding districts to the west and south in order to balance populations. Notably, the community of Six Nations of the Grand River has been preserved but is now located within the district to the south, newly named as Haldimand—Norfolk—SIX Nations.
Additionally, in the interest of achieving voter parity, a series of minor boundary changes were made to balance populations in the districts surrounding Kitchener, Waterloo, and Cambridge.
The community of Hespeler, south of the Speed River, has been added to the proposed district of Cambridge to better unify the City of Cambridge. The Township of North Dumfries has been shifted from the existing district of Cambridge and into the proposed district of Kitchener South—North Dumfries.
Several district names have been changed to better describe their locations or reflect communities of interest within the districts.
The new deviations from the Quota in the proposed redistribution plan are shown in Table 13B.
| Electoral Districts | Population ‒ 2021 | Deviation from Quota ‒ 2022 |
|---|---|---|
| Brantford | 118,167 | 1.35% |
| Cambridge | 122,099 | 4.73% |
| Haldimand—Norfolk—Six Nations | 122,813 | 5.34% |
| Kitchener Centre | 114,595 | -1.71% |
| Kitchener—Conestoga | 114,856 | -1.49% |
| Kitchener South—North Dumfries | 114,179 | -2.07% |
| Oxford—Brant | 124,844 | 7.08% |
| Waterloo | 121,436 | 4.16% |
| Average | 119,124 | 2.17% |
| Range (most populous to least populous) | 10,665 | 9.15 pp |
pp = percentage points
Southwestern Ontario
Southwestern Ontario Existing Districts
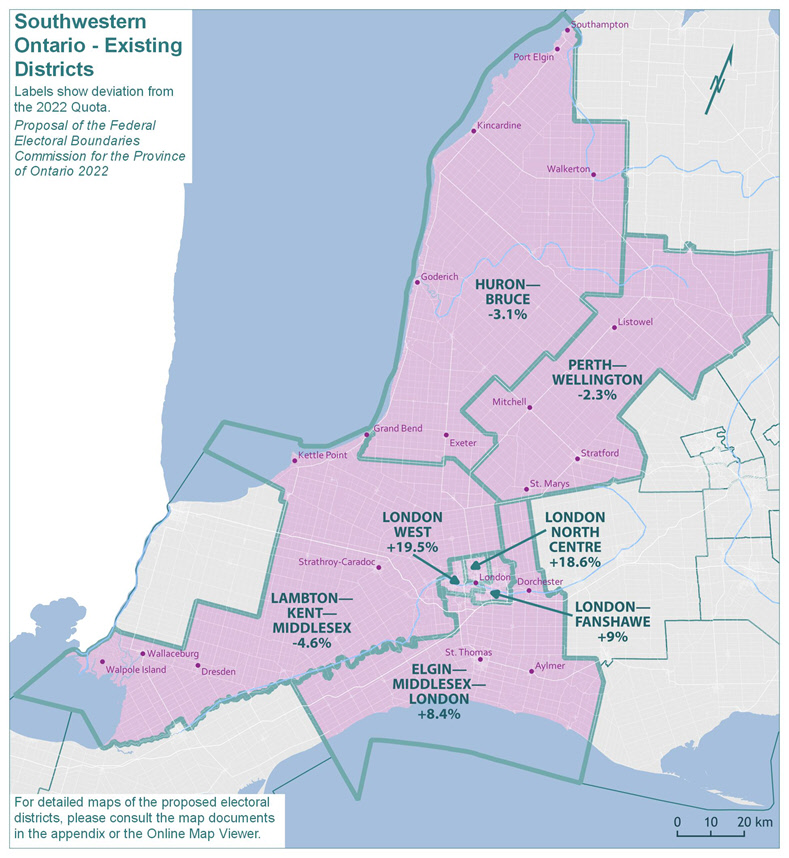
Text version of "Southwestern Ontario Existing Districts"
Labels show deviation from the 2022 Quota.
Proposal of the Federal Electoral Boundaries Commission for the Province of Ontario 2022
For detailed maps of the proposed electoral districts, please consult the map documents in the appendix or the Online Map Viewer.
| Electoral district | Deviation |
|---|---|
| Elgin—Middlesex—London | 8.4% |
| Huron—Bruce | -3.1% |
| Lambton—Kent—Middlesex | -4.6% |
| London North Centre | 18.6% |
| London West | 19.5% |
| London—Fanshawe | 9.0% |
| Perth—Wellington | -2.3% |
Southwestern Ontario Proposed Districts
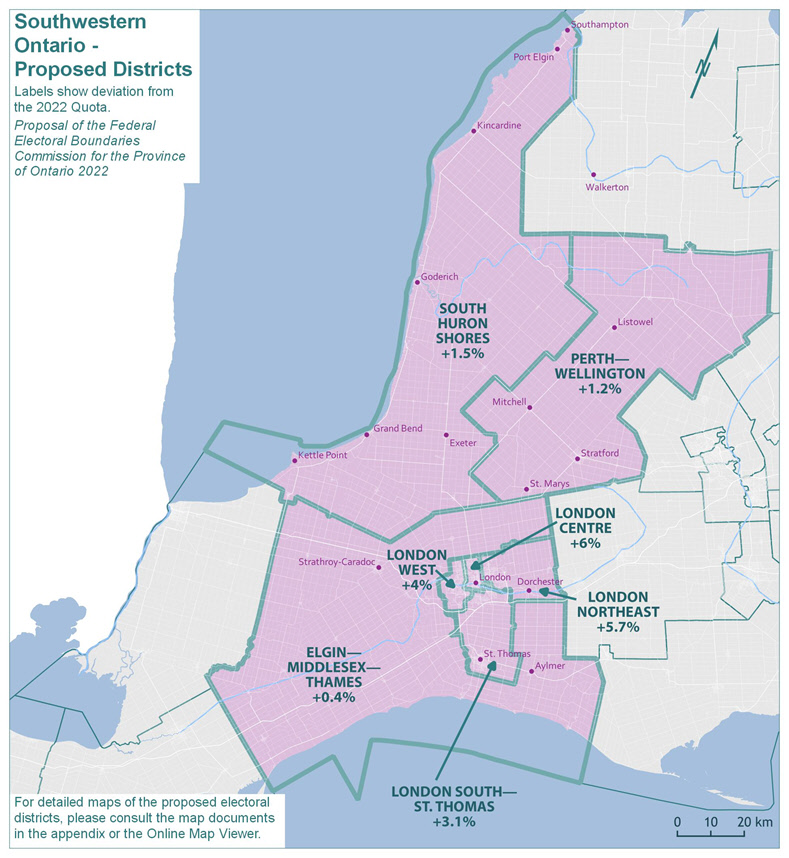
Text version of "Southwestern Ontario Proposed Districts"
Labels show deviation from the 2022 Quota.
Proposal of the Federal Electoral Boundaries Commission for the Province of Ontario 2022
For detailed maps of the proposed electoral districts, please consult the map documents in the appendix or the Online Map Viewer.
| Electoral district | Deviation |
|---|---|
| Elgin—Middlesex—Thames | 0.4% |
| South Huron Shores | 1.5% |
| London Centre | 6.0% |
| London Northeast | 5.7% |
| London South—St. Thomas | 3.1% |
| London West | 4.0% |
| Perth—Wellington | 1.2% |
The population of Southwestern Ontario grew by 11.1%, from 782,285 in 2011 to 869,137 in 2021. The remainder of Ontario grew by 10.6% in the same period.
The existing seven electoral districts in this geographic piece would have an average 2021 population of 124,162 and an average deviation of 6.5% from the Quota. The absolute range between the least and most populous districts would be 24.1 percentage points. The populations and deviations from the Quota for the existing electoral districts are shown in Table 14A.
| Electoral Districts | Population ‒ 2011 | Deviation from Quota ‒ 2012 | Population ‒ 2021 | Deviation from Quota ‒ 2022 |
|---|---|---|---|---|
| Elgin—Middlesex—London | 110,109 | 3.67% | 126,428 | 8.44% |
| Huron—Bruce | 104,842 | -1.29% | 112,929 | -3.14% |
| Lambton—Kent—Middlesex | 105,919 | -0.28% | 111,242 | -4.59% |
| London—Fanshawe | 119,334 | 12.35% | 127,068 | 8.99% |
| London North Centre | 118,079 | 11.17% | 138,255 | 18.58% |
| London West | 119,090 | 12.12% | 139,305 | 19.48% |
| Perth—Wellington | 104,912 | -1.23% | 113,910 | -2.30% |
| Average | 111,755 | 5.22% | 124,162 | 6.49% |
| Range (most populous to least populous) | 14,492 | 13.64 pp | 28,063 | 24.07 pp |
pp = percentage points
The Commission noted that the three existing and largely urban districts within the City of London are underrepresented with populations that are 9%, 18.6% and 19.5% above the Quota. Consequently, considerable redrawing was required. Recognizing the urban growth in all directions, the boundaries of these three districts are reconfigured to better balance populations with adjacent and more rural districts.
Recognizing the development in the southern part of the City of London and the northern part of the City of St. Thomas, these areas are both included in the proposed district of London South—ST. Thomas.
In the more northern part of the City of London, the boundaries of London West and the newly named London Centre (the existing district of London North Centre) are modestly changed. The boundaries of the existing district of London—Fanshawe are shifted to the east, and this district is renamed London Northeast.
In the southern portion of this geographic piece, the newly named Elgin—Middlesex—Thames extends from Kent Bridge Road (County Road 15) in Chatham-Kent at its western edge and wraps around the City of London along the east. This district comprises portions of the existing districts of Elgin—Middlesex—London and Lambton—Kent—Middlesex.
In the northern portion of this geographic piece, the districts of Perth—Wellington and the newly named South Huron Shores (the existing district of Huron—Bruce) are largely unchanged.
Many of the districts in this piece are renamed to better describe their locations and reflect their communities of interest.
The new deviations from the Quota in the proposed redistribution plan are shown in Table 14B.
| Electoral Districts | Population ‒ 2021 | Deviation from Quota ‒ 2022 |
|---|---|---|
| Elgin—Middlesex—Thames | 117,082 | 0.42% |
| London Centre | 123,531 | 5.95% |
| London Northeast | 123,241 | 5.70% |
| London South—St. Thomas | 120,208 | 3.10% |
| London West | 121,199 | 3.95% |
| Perth—Wellington | 117,974 | 1.19% |
| South Huron Shores | 118,316 | 1.48% |
| Average | 120,222 | 3.11% |
| Range (most populous to least populous) | 6,449 | 5.53 pp |
pp = percentage points
Southernmost Ontario
Southernmost Ontario Existing Districts
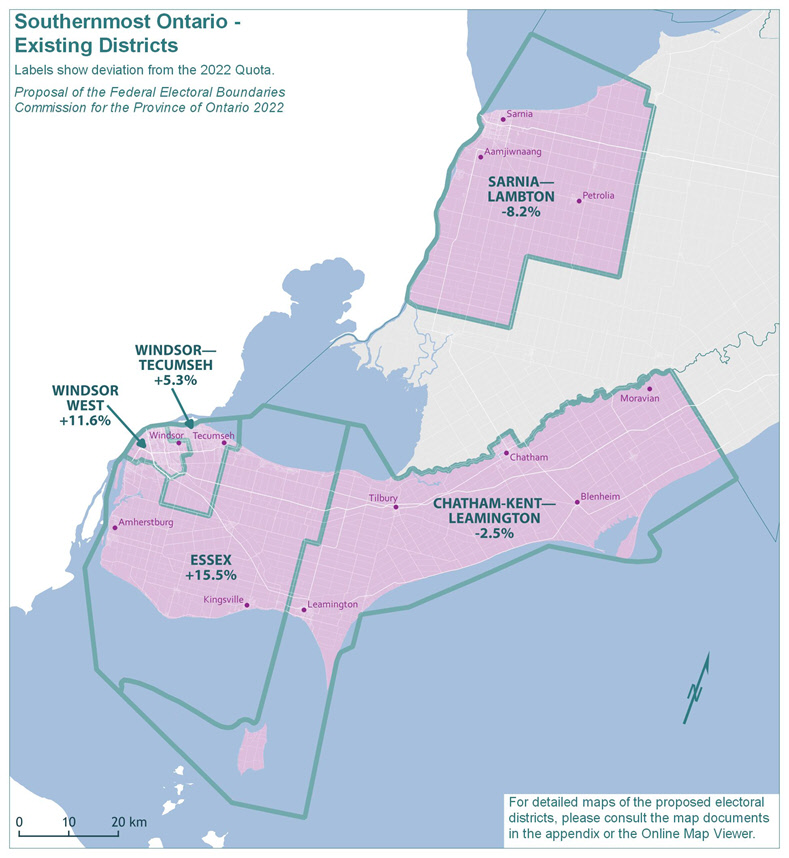
Text version of "Southernmost Ontario Existing Districts"
Labels show deviation from the 2022 Quota.
Proposal of the Federal Electoral Boundaries Commission for the Province of Ontario 2022
For detailed maps of the proposed electoral districts, please consult the map documents in the appendix or the Online Map Viewer.
| Electoral district | Deviation |
|---|---|
| Chatham-Kent—Leamington | -2.5% |
| Essex | 15.5% |
| Sarnia—Lambton | -8.2% |
| Windsor West | 11.6% |
| Windsor—Tecumseh | 5.3% |
Southwestern Ontario Proposed Districts
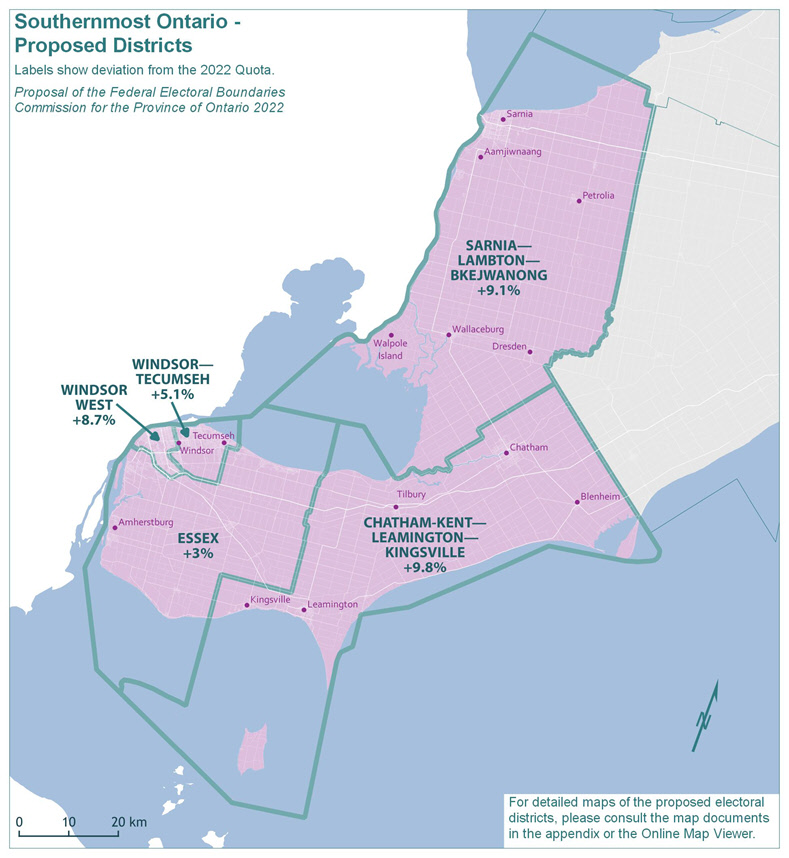
Text version of "Southwestern Ontario Proposed Districts"
Labels show deviation from the 2022 Quota.
Proposal of the Federal Electoral Boundaries Commission for the Province of Ontario 2022
For detailed maps of the proposed electoral districts, please consult the map documents in the appendix or the Online Map Viewer.
| Electoral district | Deviation |
|---|---|
| Chatham-Kent—Leamington—Kingsville | 9.8% |
| Essex | 3.0% |
| Sarnia—Lambton—Bkejwanong | 9.1% |
| Windsor—Tecumseh | 5.1% |
| Windsor West | 8.7% |
The population of the southernmost part of Ontario grew by 6.1%, from 573,137 in 2011 to 608,347 in 2021. The remainder of Ontario grew by 10.9% in the same period.
The existing five electoral districts in this geographic piece would have an average 2021 population of 121,669 and an average deviation of 4.4% above the Quota. As indicated by the deviation range (23.7 percentage points), there are substantial disparities in the population size of districts. The populations and deviations from the Quota for the existing electoral districts are shown in Table 15A.
| Electoral Districts | Population ‒ 2011 | Deviation from Quota ‒ 2012 | Population ‒ 2021 | Deviation from Quota ‒ 2022 |
|---|---|---|---|---|
| Chatham-Kent—Leamington | 111,866 | 5.32% | 113,654 | -2.52% |
| Essex | 120,477 | 13.43% | 134,656 | 15.50% |
| Sarnia—Lambton | 106,293 | 0.07% | 107,077 | -8.16% |
| Windsor—Tecumseh | 115,528 | 8.77% | 122,798 | 5.32% |
| Windsor West | 118,973 | 12.01% | 130,162 | 11.64% |
| Average | 114,627 | 7.92% | 121,669 | 4.36% |
| Range (most populous to least populous) | 14,184 | 13.36 pp | 27,579 | 23.66 pp |
pp = percentage points
In this area, the Commission aimed to reduce the significant population disparities among districts. This necessitates shifting the boundary of Essex westward to reduce its population size. The community of Kingsville is incorporated into the proposed district of Chatham-Kent—Leamington—Kingsville. The communities of Wallaceburg and Dresden and the Walpole Island First Nation are added to the proposed district of Sarnia—Lambton—Bkejwanong. The boundaries of the proposed districts of Windsor West and Windsor—Tecumseh have been adjusted to balance population equality.
The proposed boundary reconfiguration reduces the range of deviations in this area to seven percentage points. The proposed districts remain manageable in geographic size and respect as much as possible historical patterns.
The new population counts and deviations from the Quota in the proposed redistribution plan are shown in Table 15B.
| Electoral Districts | Population ‒ 2021 | Deviation from Quota ‒ 2022 |
|---|---|---|
| Chatham-Kent—Leamington—Kingsville | 128,045 | 9.83% |
| Essex | 120,132 | 3.04% |
| Sarnia—Lambton—Bkejwanong | 127,200 | 9.10% |
| Windsor—Tecumseh | 122,533 | 5.10% |
| Windsor West | 126,695 | 8.67% |
| Average | 124,921 | 7.15% |
| Range (most populous to least populous) | 7,913 | 6.79 pp |
pp = percentage points