
Part E – The Geographic Pieces – Ontario
The Commission is presenting our final report by referencing 15 geographic pieces. For each of these, we present visual illustrations of the existing, proposed and final electoral districts. We also provide a description of the most significant changes.
In addition, we have included three tables for each geographic piece, with the districts listed in alphabetical order.
The first table (A) lists the existing electoral districts as established pursuant to the 2012 redistribution process. The table shows their populations as determined by the 2011 Census, and their deviations from the provincial Quota established in 2012, followed by their populations in 2021 and the resulting deviations from the 2022 Quota. The bottom rows present summary data for those existing districts including, most notably, the average deviation from the Quota and the range in deviations from the Quota. The range indicates the total magnitude of deviation from the Quota between the least and most populous districts in a geographic piece. This first table thus reveals the variation from population equality within a geographic piece as well as the changes that have arisen since the last redistribution.
The second table (B) lists the proposed electoral districts as set out in our proposed redistribution plan, their 2021 populations and their deviations from the 2022 Quota. The bottom row presents summary data for the proposed districts, including the range in deviations from the 2022 Quota.
The third table (C) lists the districts established in our final redistribution plan, their 2021 populations and their deviations from the 2022 Quota. The bottom row presents summary data for the districts, including the range in deviations from the 2022 Quota.
Detailed maps of the final redistribution plan with legal descriptions can be reviewed online at redistribution2022.ca via the Map Viewer tool, which allows each user to enter a specific address and locate the applicable electoral district.
In this section, we first address the two geographical pieces where we concluded that it was necessary to reduce the number of districts: Northern Ontario and the City of Toronto. The discussion will then proceed with the rest of the geographic pieces, from east to west.
Northern Ontario
Northern Ontario - Existing Districts

Text version of "Northern Ontario - Existing Districts"
Labels show deviation from the 2022 Quota.
Report of the Federal Electoral Boundaries Commission for the Province of Ontario
For more detailed maps, please consult the maps in the appendix or the Online Map Viewer.
| Electoral district | Deviation |
|---|---|
| Algoma—Manitoulin—Kapuskasing | -31.1% |
| Kenora | -44.9% |
| Nickel Belt | -18.6% |
| Nipissing—Timiskaming | -23.0% |
| Parry Sound—Muskoka | -10.4% |
| Sault Ste. Marie | -32.0% |
| Sudbury | -18.1% |
| Thunder Bay—Rainy River | -29.4% |
| Thunder Bay—Superior North | -28.5% |
| Timmins—James Bay | -30.7% |
Northern Ontario - Proposed Districts

Text version of "Northern Ontario - Proposed Districts"
Labels show deviation from the 2022 Quota.
Report of the Federal Electoral Boundaries Commission for the Province of Ontario
For more detailed maps, please consult the maps in the appendix or the Online Map Viewer.
| Electoral district | Deviation |
|---|---|
| Cochrane—Timmins—Timiskaming | -8.2% |
| Kenora—Thunder Bay—Rainy River | -13.3% |
| Kiiwetinoong—Mushkegowuk | -68.8% |
| Manitoulin—Nickel Belt | -14.9% |
| Nipissing | -15.0% |
| Parry Sound—Muskoka | -12.3% |
| Sault Ste. Marie | -16.6% |
| Sudbury | -2.6% |
| Thunder Bay—Superior North | -15.1% |
Northern Ontario - Final Districts
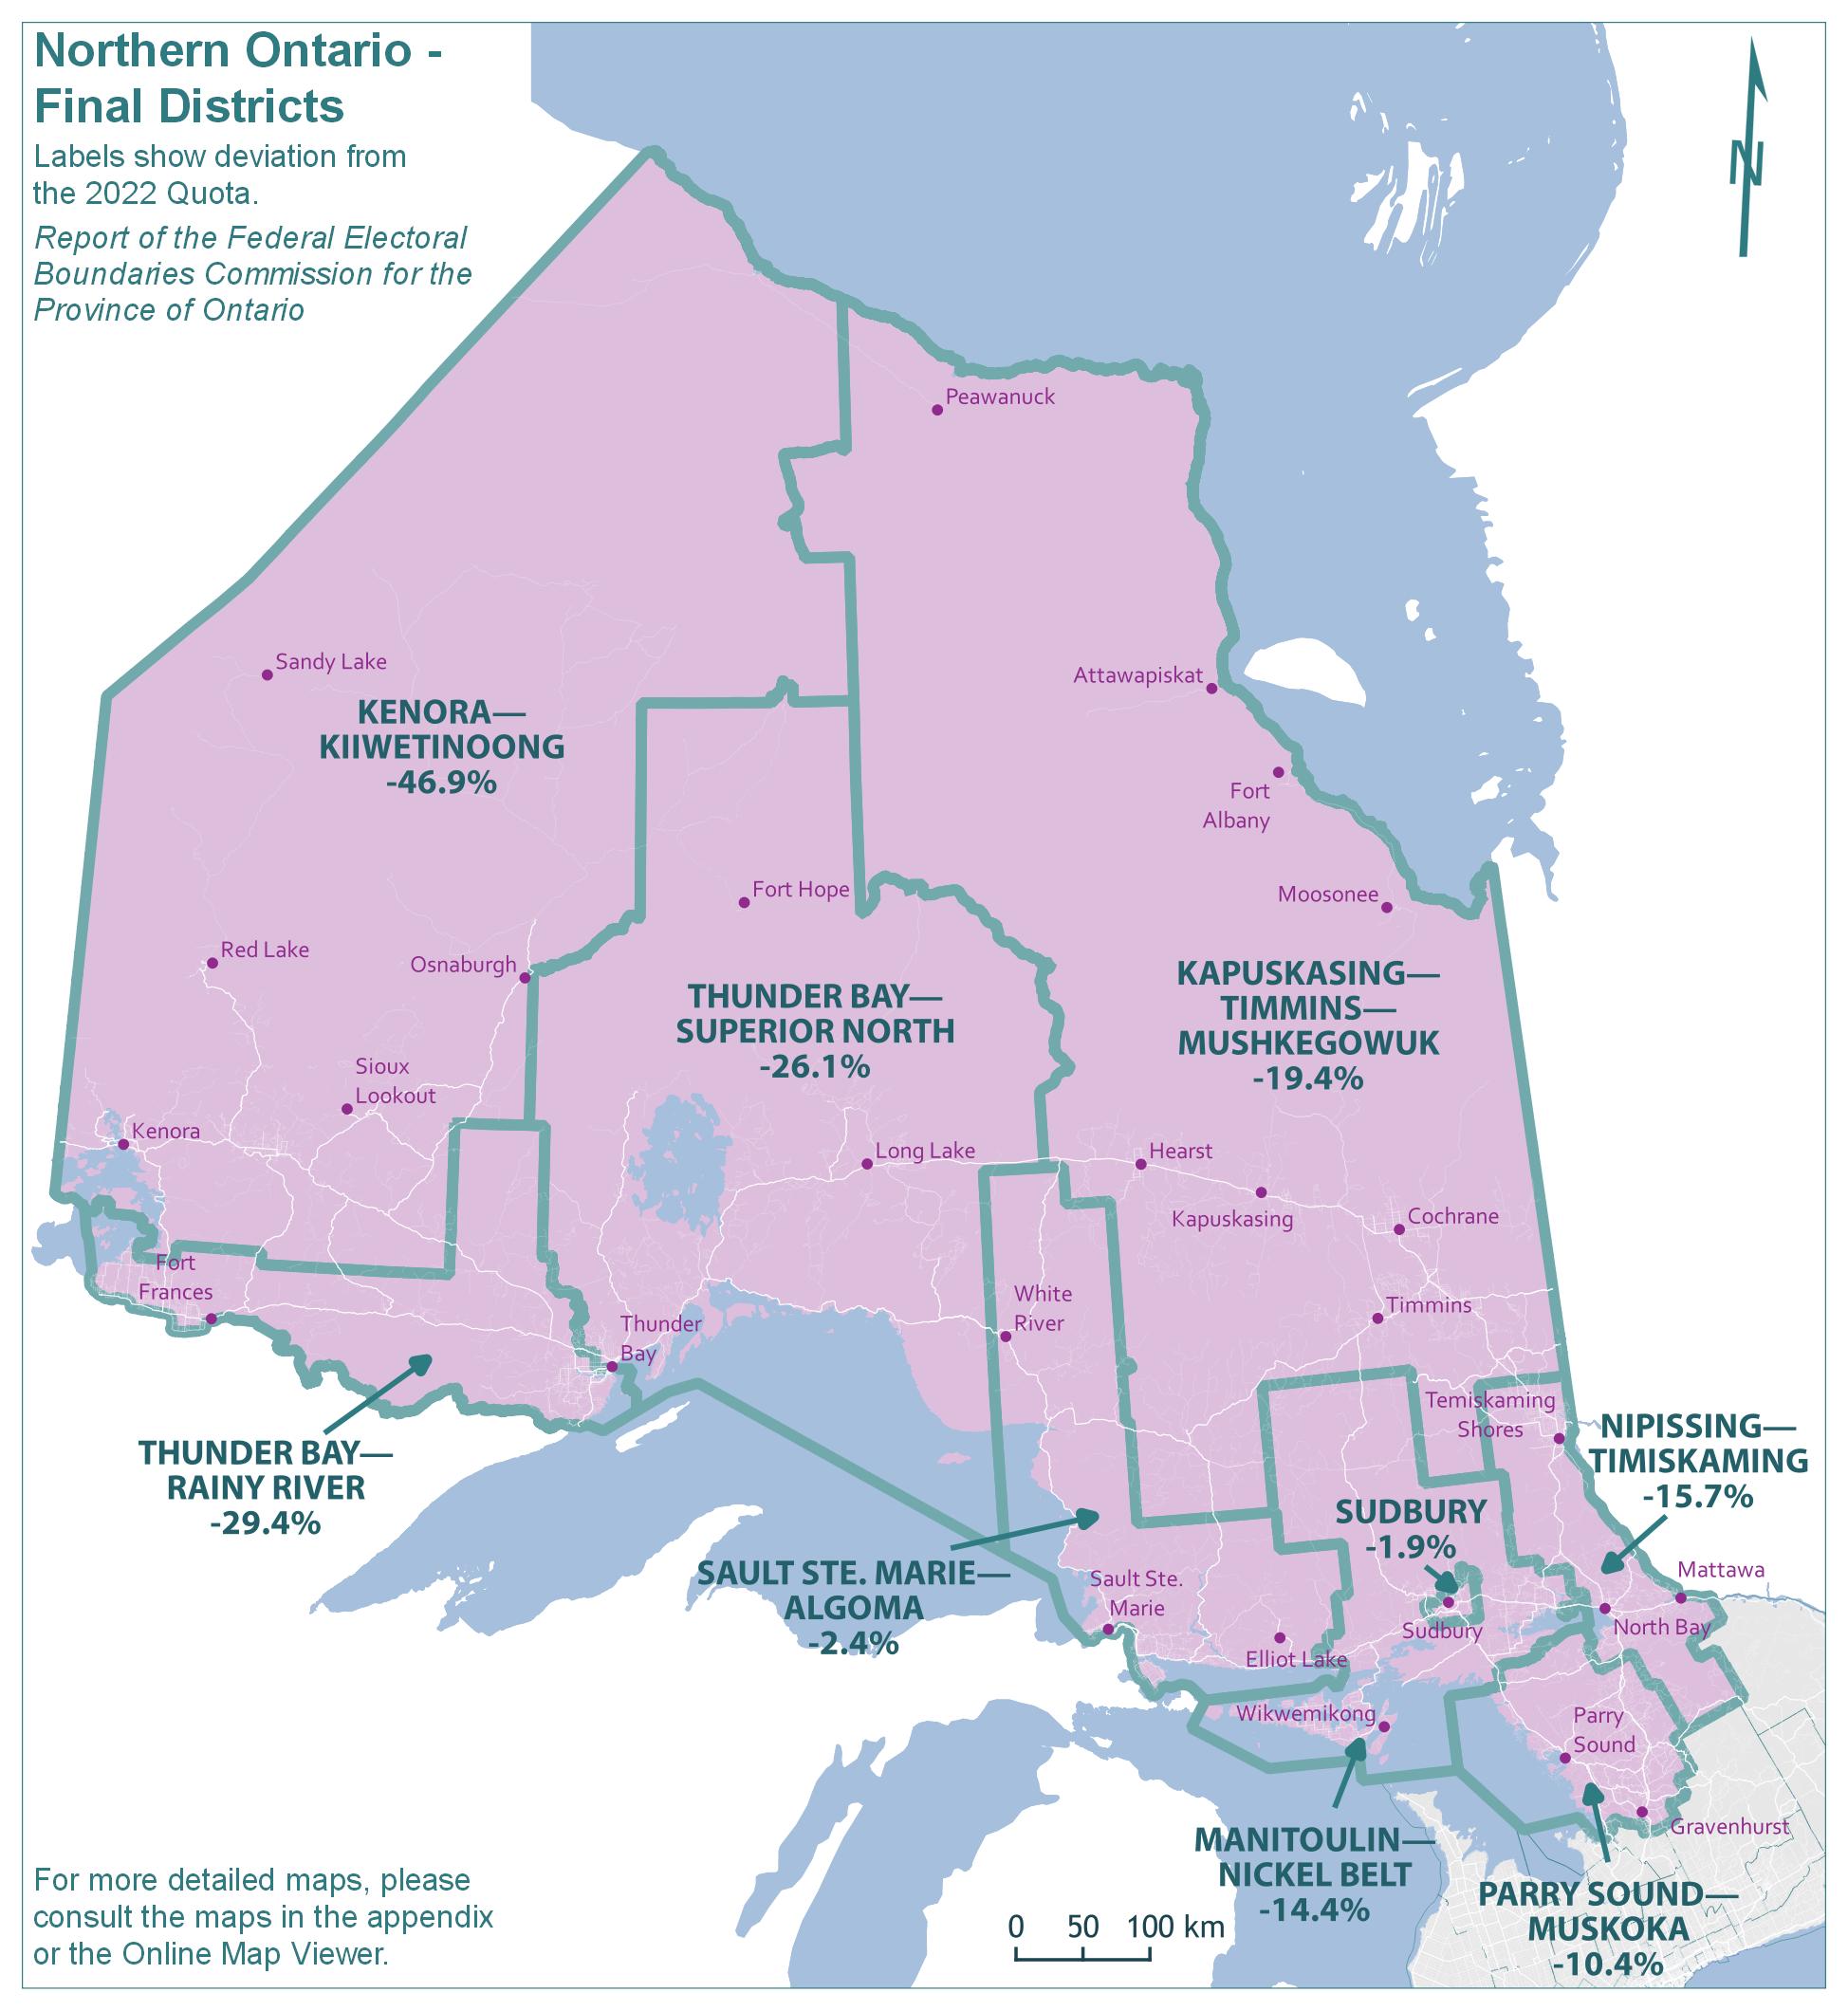
Text version of "Northern Ontario - Final Districts"
Labels show deviation from the 2022 Quota.
Report of the Federal Electoral Boundaries Commission for the Province of Ontario
For more detailed maps, please consult the maps in the appendix or the Online Map Viewer.
| Electoral district | Deviation |
|---|---|
| Kapuskasing—Timmins—Mushkegowuk | -19.4% |
| Kenora—Kiiwetinoong | -46.9% |
| Manitoulin—Nickel Belt | -14.4% |
| Nipissing—Timiskaming | -15.7% |
| Parry Sound—Muskoka | -10.4% |
| Sault Ste. Marie—Algoma | -2.4% |
| Sudbury | -1.9% |
| Thunder Bay—Rainy River | -29.4% |
| Thunder Bay—Superior North | -26.1% |
There was only modest population growth in Northern Ontario, compared to the rest of the province, over the past decade.
The population of Northern Ontario grew by 2.8% (from 831,984 in 2011 to 855,128 in 2021), while the remainder of Ontario grew by 11.2% in the same period.
The populations and deviations from the Quota for the 10 existing electoral districts in Northern Ontario are shown in Table 1A. These districts have an average 2021 population of 85,513 — a figure that is 26.7% below the Quota of 116,590. While Kenora was deemed an extraordinary circumstances
district in the 2013 Redistribution Order, there are presently five additional districts in this region with populations that fall more than 25 per cent below the 2022 Quota.
| Electoral Districts | Population – 2011 | Deviation from Quota – 2012 | Population – 2021 | Deviation from Quota – 2022 |
|---|---|---|---|---|
| Algoma—Manitoulin—Kapuskasing | 79,801 | -24.87% | 80,310 | -31.12% |
| Kenora (Extraordinary Circumstance) | 55,977 | -47.30% | 64,261 | -44.88% |
| Nickel Belt | 90,962 | -14.36% | 94,947 | -18.56% |
| Nipissing—Timiskaming | 90,996 | -14.33% | 89,781 | -22.99% |
| Parry Sound—Muskoka | 91,233 | -14.10% | 104,494 | -10.37% |
| Sault Ste. Marie | 82,052 | -22.75% | 79,331 | -31.96% |
| Sudbury | 92,048 | -13.34% | 95,537 | -18.06% |
| Thunder Bay—Rainy River | 82,984 | -21.87% | 82,357 | -29.36% |
| Thunder Bay—Superior North | 82,827 | -22.02% | 83,325 | -28.53% |
| Timmins—James Bay | 83,104 | -21.76% | 80,785 | -30.71% |
| Average | 83,198 | -21.67% | 85,513 | -26.65% |
| Range (most populous to least populous) | 36,071 | 33.96 pp | 40,233 | 34.51 pp |
| Average – Excluding Extraordinary Circumstance | 86,223 | -18.82% | 87,874 | -24.63% |
| Range – Excluding Extraordinary Circumstance | 12,247 | 11.53 pp | 25,163 | 21.59 pp |
pp = percentage points
The initial proposal for the North
Given these extreme disparities from population equality and the distinctive challenges of representation in the North, the Commission discussed at great length the meaning of 'effective representation' and the challenges of balancing the considerations set forth under the Electoral Boundaries Readjustment Act.
The Commission noted that in 2016 the province of Ontario established the Far North Electoral Boundaries Commission (FNEBC) to make recommendations regarding the creation of at least one, and no more than two, new provincial electoral districts from the geography of the current provincial electoral districts of Kenora—Rainy River and Timmins—James Bay.
As previously discussed, the Commission further noted the distinctions between its own mandate as set out in the rules prescribed by the federal Electoral Boundaries Readjustment Act and the legislative mandate of the Ontario Far North Electoral Boundaries Commission. Our Commission is constrained by its mandate and by the smaller number of districts to be created.
The Census population data and the mandate respecting voter parity revealed the potential for a reduction of two electoral districts in Northern Ontario. Our Commission considered this possibility but decided to propose a reduction of one district, thus resulting in nine districts in total, including one extraordinary circumstances
district. Our Commission acknowledged that most of the eight non-extraordinary districts in Northern Ontario have significant deviations from the Quota (see Table 1B). However, we concluded that any further reduction in the number of districts in the North would imperil the principle of effective representation in this part of the province, considering its widely dispersed population and communities of interest.
The proposed redistribution plan established one extraordinary circumstances
district, Kiiwetinoong—Mushkegowuk, which encompassed and reflected the exceptional nature of the far North – an isolated and geographically substantial area, in large part not accessible by road, in which the majority of the population is Indigenous.
The eight other proposed electoral districts in Northern Ontario were what we believed to be of manageable geographic size, and accessible via the well-established roadway network anchored by Highways 11 and 17. Their boundaries were redrawn to reduce the large deviations from the Quota.
As set out in the proposed redistribution plan, where a community of Francophones represented a substantial percentage of a riding, the Commission endeavoured in its proposal to ensure that their representation was not diluted or diminished.
In addition to the proposed riding name of Kiiwetinoong—Mushkegowuk, other reconfigured districts were renamed to reflect the communities comprising them.
The populations and deviations from the Quota for the proposed redistribution plan are shown below in Table 1B.
| Electoral Districts | Population – 2021 | Deviation from Quota – 2022 |
|---|---|---|
| Cochrane—Timmins—Timiskaming | 107,092 | -8.15% |
| Kenora—Thunder Bay—Rainy River | 101,097 | -13.29% |
| Kiiwetinoong—Mushkegowuk (Extraordinary Circumstance) | 36,325 | -68.84% |
| Manitoulin—Nickel Belt | 99,268 | -14.86% |
| Nipissing | 99,149 | -14.96% |
| Parry Sound—Muskoka | 102,255 | -12.30% |
| Sault Ste. Marie | 97,299 | -16.55% |
| Sudbury | 113,618 | -2.55% |
| Thunder Bay—Superior North | 99,035 | -15.06% |
| Average | 95,015 | -18.51% |
| Range (most populous to least populous) | 77,293 | 66.29 pp |
| Average – Excluding Extraordinary Circumstance | 102,352 | -12.22% |
| Range – Excluding Extraordinary Circumstance | 16,319 | 14.00 pp |
The public feedback in the North
This proposal for Northern Ontario generated considerable public interest, input and criticism. There were submissions related to several topics; however, there was an especially high volume of submissions urging the Commission to maintain 10 ridings in this region. This included resolutions from dozens of municipalities, political representatives, various organizations operating in the North, and the general public.
There were repeated assertions that districts in rural Newfoundland & Labrador, Nova Scotia, Prince Edward Island, New Brunswick and Saskatchewan have smaller populations than Northern Ontario's districts and yet their districts have been maintained. The reason for this is that the quota in these provinces is significantly less than Ontario's Quota, as the table below indicates.
| Province | Population Quota |
|---|---|
| Alberta | 115,206 |
| British Columbia | 116,300 |
| Manitoba | 95,868 |
| New Brunswick | 77,561 |
| Newfoundland and Labrador | 72,936 |
| Nova Scotia | 88,126 |
| Ontario | 116,590 |
| Prince Edward Island | 38,583 |
| Quebec | 110,413 |
| Saskatchewan | 80,893 |
If, as elected representatives asserted, Northern Ontario should be represented by more elected representatives, Ontario would have to be assigned more seats, a differential Quota would have to be applied to northern regions of the province, or guaranteed
districts within specified geographies would have to be identified in legislation. All of these alternatives are in the hands of Parliament.
The Commission noted that these recommendations have been previously considered. For example, see the Chief Electoral Officer's 2005 Report, Enhancing the Values of Redistribution, tabled to the House of Commons.
The Commission also noted that some municipalities passed a resolution to petition the federal government to introduce legislation guaranteeing a minimum number of ridings for Northern Ontario.
During public consultations, the Commission was asked to explain its reasoning for not maintaining ten constituencies in the North, despite the option to do so. Some submissions noted the 2011-12 Commission's assertion that 10 districts were required to deliver effective representation in Northern Ontario. While we address the challenge of maintaining effective representation in another section of this report, we do note here that circumstances are not perfectly similar between 2012 and 2022.
As previously described, the population growth between Northern Ontario and the remainder of Ontario is starkly different: 2.8% compared to 11.2%, respectively. This mismatch in population growth, and the addition of only one seat to all of Ontario, has led to all districts in Northern Ontario falling further below the Quota. Indeed, if 10 districts were maintained in Northern Ontario, the average district population would be just 85,513, or 73% of the Quota (whereas in 2012 it was 78% of the Quota).
Continued gaps in population growth between Northern Ontario and the rest of the province will only make this disparity more acute. The historical record bears this out. The 1987-88 Commission established 11 districts in Northern Ontario; however, the subsequent Commission in 2001-02 reduced this to 10. The ability of the 2011-12 Commission to maintain 10 seats was facilitated by legislation (The Fair Representation Act, 2011) which increased the number of districts in some provinces. That legislative change gave Ontario 15 additional seats, whereas Ontario has only been allocated one additional seat in the current redistribution. Halting the further decline of the number of seats in the North will likely require legislative action.
The Commission considered a variety of alternative maps for the North, and reviewed proposals that would maintain 10 seats in this region by deducting one from elsewhere in the province. (Interestingly, we received and reviewed corollary proposals with respect to the City of Toronto that aimed to preserve 25 seats there, while reducing one from elsewhere in the province). In the Commission's view, this would not be consistent with the broader and principal goal of assuring population equality between constituencies, while ensuring effective representation.
Redrawing of Northern Ontario
Many submissions applauded our efforts to increase the representation and the voting power of northern First Nations. However, concerns were expressed because of the significant challenges of managing a district of the proposed size of Kiiwetinoong—Mushkegowuk.
The proposed new district was described as daunting in size and breadth, imposing multiple logistical difficulties. Among them is the fact that the fly-in communities of such a vast riding would not be accessible from one central hub, as flights to the Northwest must go through Thunder Bay and Sioux Lookout, flights to the Northeast must go through Timmins, and Thunder Bay and Timmins are a day's drive apart with no direct flights connecting them. While it was generally seen as a positive development to create a district that was majority or substantially Indigenous to give a strong voice and focus to Indigenous perspectives, the Commission agrees the size and navigation challenges make this proposal unworkable.
In addition, it became clear that the proposed district of Kiiwetinoong—Mushkegowuk inappropriately divided the Anishinaabe Nation in Treaty #3. The Commission had failed to observe the Tribal Council lines that separate the northern and southern halves of Treaty #3.
The submissions from Indigenous people were very valuable. As the Commission noted previously, establishing within the federal redistribution process an opportunity for formal consultations with Indigenous communities at multiple stages of the process would be desirable.
The Commission also received many valuable submissions from the Franco-Ontarian community. Some submissions expressed concerns that the removal of a district from Northern Ontario would jeopardize the long-term survival of the French language and minority official language rights in this region.
The problem of slow population growth in the North is one confronting Franco-Ontarians and other population groups in the region. As discussed, it is this overall pattern of slow growth relative to the rest of the province that necessitates removing one seat from this region. Our Commission has nevertheless drawn district boundaries in a way that does not fragment the Franco-Ontarian community or reduce Francophone density within constituencies.
In response to the public submissions, and in consideration of the issues discussed above, the Commission significantly redrew the northern part of the province with an east-west division that retains largely intact the two-district configuration in the far northwestern and northeastern segments (Kenora—Kiiwetinoong and Kapuskasing—Timmins—Mushkegowuk). This final redistribution plan creates districts of more manageable geographic size, an important factor under the legislation. It better respects transportation networks, especially flight networks to remote fly-in communities. It better aligns the communities within Tribal Councils. This plan also protects Franco-Ontarian communities of interest. And, as much as possible, it aligns the electoral boundaries with Northern Ontario district boundaries (which are important lower-level governance structures with respect to service provision in this region). Finally, while it was not possible in this plan to create a district with a majority Indigenous population, the two geographically large districts referenced above each have significant northern Indigenous populations, which helps to ensure that Indigenous interests are not diluted and creates the potential for the election of Indigenous candidates.
The extraordinary circumstances
in the North
The Commission initially proposed just one extraordinary circumstances
district, Kiiwetinoong—Mushkegowuk, a vast land mass with a population of just 36,325 (-68.8% below the provincial Quota). This proposal far exceeded population deviations previously established in Ontario (for example, the existing exceptional circumstances
district of Kenora has a deviation of -44.9%). And it would possibly be the largest intraprovincial deviation across the country (the largest in the 2013 federal redistribution being the district of Labrador, with a deviation of -63.6%). For reasons discussed below, this proposal is not maintained in the final plan, and the Commission views having three extraordinary circumstance
districts with more manageable geographic size and populations with less variance from the Quota to be an improvement.
The Electoral Boundaries Readjustment Act provides that we must follow these rules:
- The population of each electoral district
shall, as close as reasonably possible, correspond to the electoral quota for the province.
- The Commission may deviate from adherence to the Quota, where necessary or desirable,
to respect the community of interest or community of identity in or the historical pattern of an electoral district;
orto maintain a manageable geographical size for districts in sparsely populated, rural or northern regions
of a province. - Where the Commission deviates from the Quota, for any of the reasons above, it must make every effort to ensure a variance of less than +/- 25% from the Quota.
- The Commission may deviate more than +/- 25% from the Quota where it finds extraordinary circumstances.
While the legislation permits deviations within +/- 25% from Quota, it is clear that representation by population is to be the primary consideration in the Commission's work, with leeway for divergence based on communities of interest and identity as well as cultural and geographical factors. Deviations beyond +/- 25%, while also permitted, must be justified as extraordinary cases.
The Commission received suggestions pertaining especially, though not exclusively, to the North, that it should allow variances greater than +/- 25% from Quota in many districts. However, only in the three northwestern districts – Kenora—Kiiwetinoong (population 61,962), Thunder Bay—Superior North (population 86,147), and Thunder Bay—Rainy River (population 82,357) – have we identified extraordinary circumstances
to justify such deviations.
This merits examination of the features that make these districts extraordinary.
Our assessment relates first to geographic size. These are among the geographically largest districts in the province, covering respectively 258,813, 132,054 and 32,688 square kilometres (see Final Electoral Districts Table in the Summary).
While there are others of somewhat comparable size (Kapuskasing—Timmins—Mushkegowuk, Manitoulin—Nickel Belt, and Sault Ste. Marie—Algoma), additional features, together with their large land base, make these three districts extraordinary. In particular, their social and physical geography (along the Manitoba border, the international border, or the north shore of Lake Superior) constrain the directions in which the boundaries of these districts can be adjusted.
Another distinctive feature is the sparsity of population, distance from urban centres, and lack of navigable year-round road networks in these districts. Transportation challenges are particularly acute in Kenora—Kiiwetinoong and Thunder Bay—Superior North, which each have many fly-in communities. While the northeastern district of Kapuskasing—Timmins—Mushkegowuk also includes fly-in communities, there is sufficient population in the municipalities along the Highway 11 corridor that this district can be drawn without exceeding -25% from the Quota.
Where our proposal did attempt, in the context of these constraints, to add population by shifting boundaries, we learned that such changes were effectively unworkable given the sizable Indigenous populations, climate and transportation challenges, service networks, and communities of interest that would be disrupted. In short, the Commission concluded that effective representation would be impaired without three extraordinary circumstance
districts.
As a result, the Commission found that extraordinary circumstances
existed in three districts justifying deviations from the Quota of -46.9%, -26.1%, and -29.4% in Kenora—Kiiwetinoong (the original extraordinary circumstance
district), Thunder Bay—Superior North, and Thunder Bay—Rainy River, respectively.
The final plan for the North
In Northwestern Ontario, the Commission has made several changes to the proposed districts.
The proposed district of Kenora—Rainy River—Thunder Bay drew substantial criticism for joining Kenora and Thunder Bay in a single district. Several submissions referenced a Northern Policy Institute study that showed Thunder Bay and Kenora to be separate economic spheres. It was also pointed out that the travel time would be substantial: a Member of Parliament would need to travel over 1,000 km to drive the Highway 11 and Highway 17 circuit from Thunder Bay to Rainy River, to Kenora, and back to Thunder Bay. Further, as previously noted, the Anishinaabe of Grand Treaty #3 sent an invaluable submission indicating that the proposed boundaries had ignored well established Tribal Council groupings.
The Commission found all of these arguments persuasive, and set out to establish three northwestern districts based on this feedback.
Thunder Bay—Rainy River has been returned to the boundaries of the existing district. Several municipal councils in the region adopted resolutions requesting this. In the City of Thunder Bay, the boundary was returned to Highway 11 and Harbour Expressway, respecting the old boundary of the amalgamated City of Fort William. The Municipality of Oliver Paipoonge (including the community of Kakabeka Falls) has been returned to the Thunder Bay—Rainy River district. This municipality was opposed to their municipality being split between two districts.
With Kenora—Kiiwetinoong, the Commission has largely restored the existing district of Kenora, a shift that respects the strong connection between the Municipalities of Kenora and Sioux Lookout and includes communities such as Dryden, Machin, Pickle Lake, Red Lake, Ear Falls, Sioux Narrows-Nestor Falls and Ignace, which are the nine municipalities working together as the Kenora District Municipal Association, which has a longstanding history of collaboration and advocacy in the region. This redrawing also respects the District Social Service Boards and the Northwestern Health Unit.
However, adjustments have been made in the area occupied by the First Nations aligning with the Matawa First Nations Management Tribal Council. These First Nations are now in Thunder Bay—Superior North. This will be further discussed below.
The final district of Thunder Bay—Superior North is similar to the existing district of the same name. As discussed above, adjustments have been made to restore the well-established boundary along Highway 11 and the Harbour Expressway.
The First Nations of the Matawa First Nations Management Tribal Council have also been moved into Thunder Bay—Superior North. This allows the entire Tribal Council to be in the same district and has the added benefit of keeping these First Nations communities connected to established transportation networks, as flights to these communities depart from Thunder Bay. This is important as the members of these First Nations access many services within the District of Thunder Bay, and the Tribal Council office is located in the City of Thunder Bay.
Thunder Bay—Rainy River, Thunder Bay—Superior North and Kenora—Kiiwetinoong respectively have deviations of -29.4%, -26.1% and -46.9%. As discussed above, there are extraordinary circumstances
justifying these variances.
The Commission was satisfied that to maintain effective representation in Thunder Bay—Rainy River, the existing alignment had to be maintained and it was necessary and desirable to permit the extraordinary circumstances
this drawing created.
Similarly, the large geographic size and the sparse population of Thunder Bay—Superior North and Kenora—Kiiwetinoong was the basis for our conclusion that it was necessary and desirable in relation to these districts.
The Cree communities of the James Bay coast and Peawanuck have been reunited with Timmins in the district of Kapuskasing—Timmins—Mushkegowuk. The district's western boundary has been drawn to include Winisk Indian Reserve No. 90, matching the provincial electoral boundaries. This allows the Weenusk First Nation in Peawanuck to be in the same districts as their reserve lands.
The Commission was advised that the James Bay Cree are connected to Timmins and Cochrane. It was noted that there is a vital link between the James Bay coastal communities and the City of Timmins for health care, transportation, education and economic development. The Mayor of Timmins reported that Timmins has established a Relationship Agreement with the Mushkegowuk Council. Flights to these northeastern communities depart from Timmins.
This district also includes the Matachewan First Nation, Brunswick House, Chapleau Ojibway, Chapleau Cree First Nation and the Township of Chapleau. These First Nations are all members of the Wabun Tribal Council and the Mushkegowuk Council, which are mostly based out of Kapuskasing—Timmins—Mushkegowuk. It was also noted that Timmins is the closest major centre to each of these communities.
The Highway 11 corridor between Hearst and Smooth Rock Falls has also been added to Kapuskasing—Timmins—Mushkegowuk. The Commission noted there was support for including Hearst in the same district as Timmins and Cochrane. The joining of these communities with the cities and communities of the existing district of Timmins—James Bay has made for a district with strong Franco-Ontarian influence: 35% of this district is Francophone, based on estimates using the 2021 Census data.
The cities of the Tri-Towns
area have been moved into Nipissing—Timiskaming. While the Commission did receive submissions indicating that these communities would prefer the status quo, the population numbers simply did not support this. The final redistribution plan reflects the submission that the whole of the Municipality of Temagami, Temiskaming Shores and North Bay should be within the same district. The southern portions of Nipissing—Timiskaming have been returned to the existing boundaries.
The district of Manitoulin—Nickel Belt has been substantially altered from the proposal, particularly based on feedback from the Franco-Ontarian community.
To identify boundaries that will protect effective representation for Franco-Ontarians, notwithstanding the reduction of one district in the North, the Commission has drawn on Census data on First Official Language Spoken as well as data on the Potential demand for federal communications and services in the minority official language to largely regroup the northern Franco-Ontarian community into two districts which now have substantial Franco-Ontarian populations, Kapuskasing—Timmins—Mushkegowuk (35% Francophone) and Manitoulin—Nickel Belt (31% Francophone), plus two others that maintain strong Franco-Ontarian influence, Sudbury (17% Francophone) and Nipissing—Timiskaming (14% Francophone).
These four districts include all the municipalities in Northern Ontario that have a Potential demand for federal communications and services in the minority official language of over 20%, with the exception of Wawa, Dubreuilville, and Greenstone. These three communities are part of the districts that they are geographically connected to: Sault Ste. Marie—Algoma for Wawa and Dubreuilville, and Thunder Bay—Superior North for Greenstone.
It was correctly pointed out that the proposed boundaries between Nickel Belt and Nipissing divided the Francophone communities existing in West Nipissing, Markstay-Warren, St.-Charles, French River, and the City of Sudbury.
These communities, which along with Killarney, work together under the umbrella of the Sudbury-East Municipal Association on projects and community issues, have been restored in the district of Manitoulin—Nickel Belt. This has created a second district in Northern Ontario with a very strong Franco-Ontarian influence: 31% of this district is Francophone.
The community of Gogama and the Mattagami First Nation have been placed in Manitoulin—Nickel Belt. This decision was made in consideration of submissions from the Gogama Chamber of Commerce, residents, and the Member of Parliament, who all stressed the alignment of their community's interests with Nickel Belt, rather than Timmins.
The Commission received support for the proposed boundary changes for the district of Sudbury which brought the district closer to the footprint of the City of Greater Sudbury, providing for continuity of service and better reflected communities of interest. It was observed that the proposed district consolidates the urban portions of the City of Greater Sudbury. The Commission was also advised that the proposed boundary changes accurately accounted for the natural boundaries that make up Sudbury such as highways, roadways, rivers and lakes.
The only modifications to Sudbury's proposed boundary is the inclusion of the community of Skead. This was in response to submissions made by individuals and elected municipal representatives that suggested that Sudbury should contain all the neighbourhoods within the former City of Nickel Centre.
The district of Sault Ste. Marie—Algoma has been largely drawn to match the City of Sault Ste. Marie and the upper-tier municipal District of Algoma. In light of this fact, the name has been changed to Sault Ste. Marie—Algoma.
The boundary with Kapuskasing—Timmins—Mushkegowuk has been drawn around the Missanabie Cree First Nation's reserves, keeping these lands in the same district as their band office in Sault Ste. Marie.
The territories of the Sagamok Anishnawbek First Nation have also been included in Sault Ste. Marie—Algoma, allowing them to be linked with most of the other First Nations within Mamaweswen, The North Shore Tribal Council.
Parry Sound—Muskoka has been mostly returned to its existing boundaries. The Township of Machar and the Village of South River had been moved to the district of Nipissing in the proposal. The Commission has moved these municipalities back into Parry Sound—Muskoka based on submissions received from the Village of South River and its residents.
One additional small change in the Parry Sound—Muskoka proposed boundary is being maintained. At the very southern tip of the district, a small change has been made to the existing boundaries to coincide with updated Census subdivision boundaries for the Township of Georgian Bay, affecting the area around Green Island and Canary Island.
The names, populations and deviations from the Quota for Northern Ontario's final districts are shown in Table 1C.
| Electoral Districts | Population – 2021 | Deviation from Quota – 2022 |
|---|---|---|
| Kapuskasing—Timmins—Mushkegowuk | 93,948 | -19.42% |
| Kenora—Kiiwetinoong (Extraordinary Circumstance) | 61,962 | -46.85% |
| Manitoulin—Nickel Belt | 99,827 | -14.38% |
| Nipissing—Timiskaming | 98,237 | -15.74% |
| Parry Sound—Muskoka | 104,504 | -10.37% |
| Sault Ste. Marie—Algoma | 113,772 | -2.42% |
| Sudbury | 114,384 | -1.89% |
| Thunder Bay—Rainy River (Extraordinary Circumstance) | 82,357 | -29.36% |
| Thunder Bay—Superior North (Extraordinary Circumstance) | 86,147 | -26.11% |
| Average | 95,015 | -18.50% |
| Range (most populous to least populous) | 52,422 | 44.96 pp |
| Average – Excluding Extraordinary Circumstance | 104,112 | -10.70% |
| Range – Excluding Extraordinary Circumstance | 20,436 | 17.53 pp |
pp = percentage points
City of Toronto
City of Toronto - Existing Districts
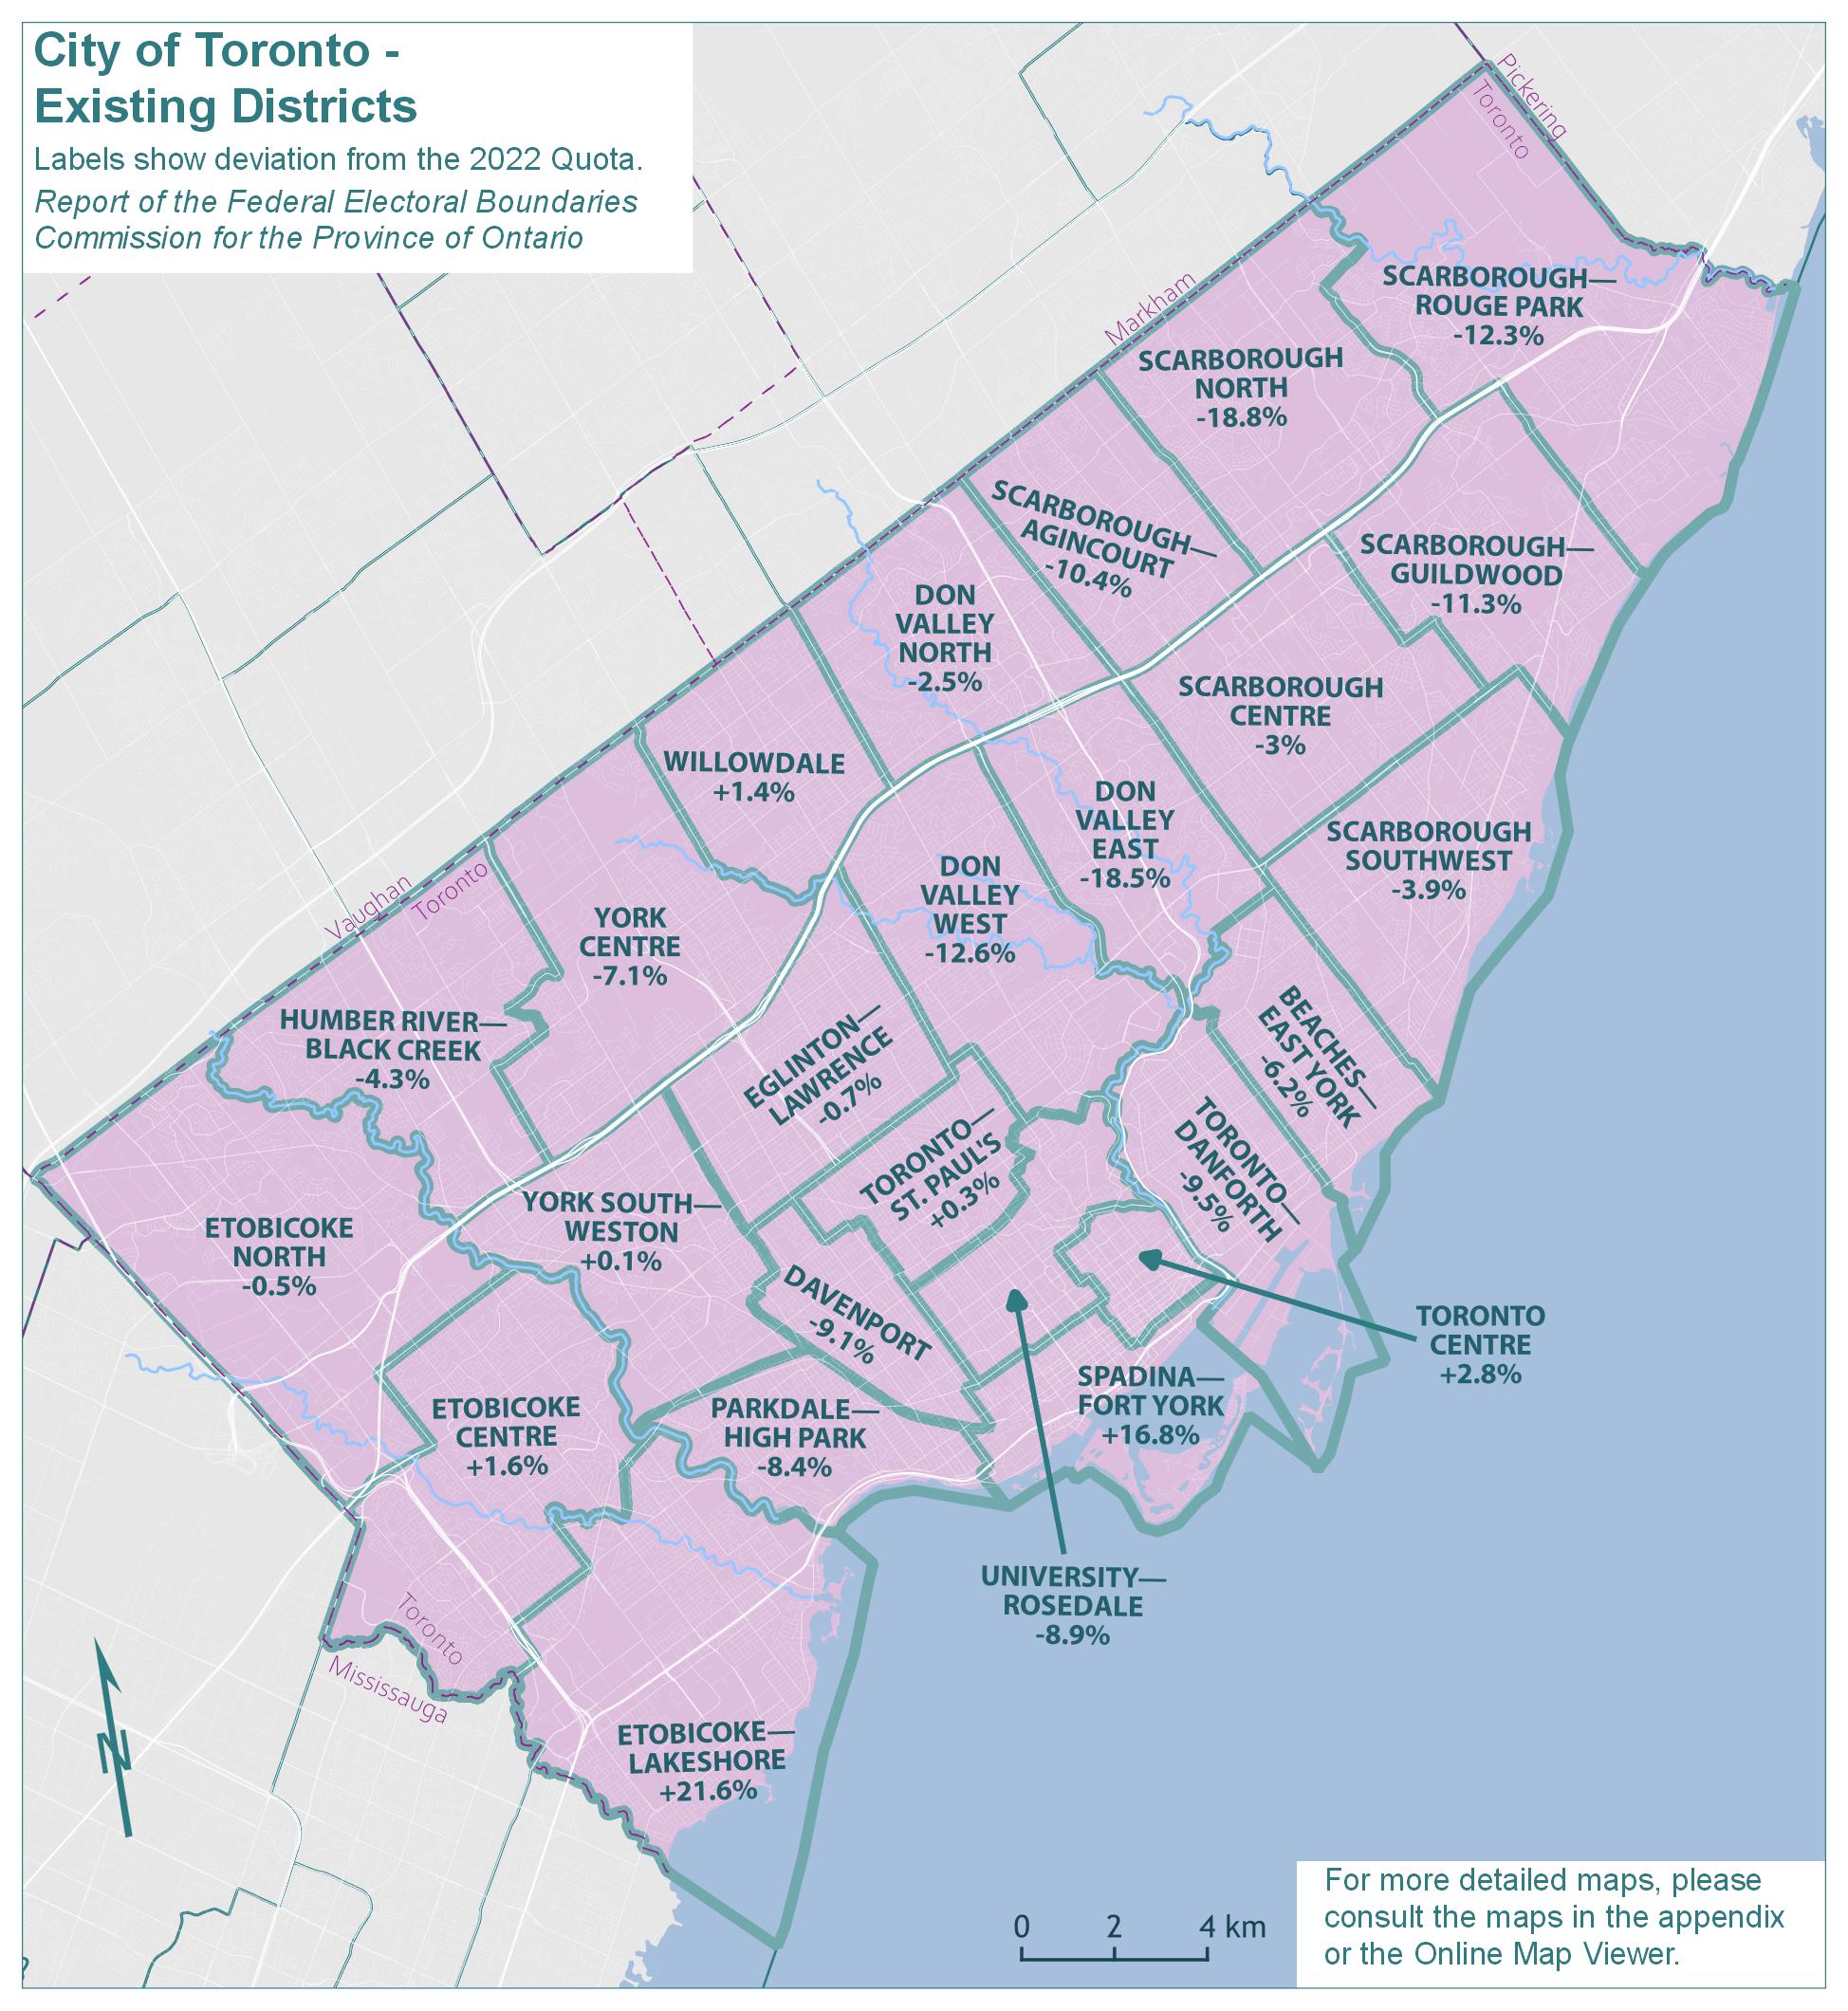
Text version of "City of Toronto - Existing Districts"
Labels show deviation from the 2022 Quota.
Report of the Federal Electoral Boundaries Commission for the Province of Ontario
For more detailed maps, please consult the maps in the appendix or the Online Map Viewer.
| Electoral district | Deviation |
|---|---|
| Beaches—East York | -6.2% |
| Davenport | -9.1% |
| Don Valley East | -18.5% |
| Don Valley North | -2.5% |
| Don Valley West | -12.6% |
| Eglinton—Lawrence | -0.6% |
| Etobicoke Centre | 1.6% |
| Etobicoke North | -0.5% |
| Etobicoke—Lakeshore | 21.6% |
| Humber River—Black Creek | -4.3% |
| Parkdale—High Park | -8.4% |
| Scarborough—Agincourt | -10.4% |
| Scarborough Centre | -3.0% |
| Scarborough—Guildwood | -11.3% |
| Scarborough North | -18.8% |
| Scarborough—Rouge Park | -12.3% |
| Scarborough Southwest | -3.9% |
| Spadina—Fort York | 16.8% |
| Toronto Centre | 2.8% |
| Toronto—Danforth | -9.5% |
| Toronto—St. Paul's | 0.3% |
| University—Rosedale | -8.9% |
| Willowdale | 1.4% |
| York Centre | -7.1% |
| York South—Weston | 0.1% |
City of Toronto - Proposed Districts
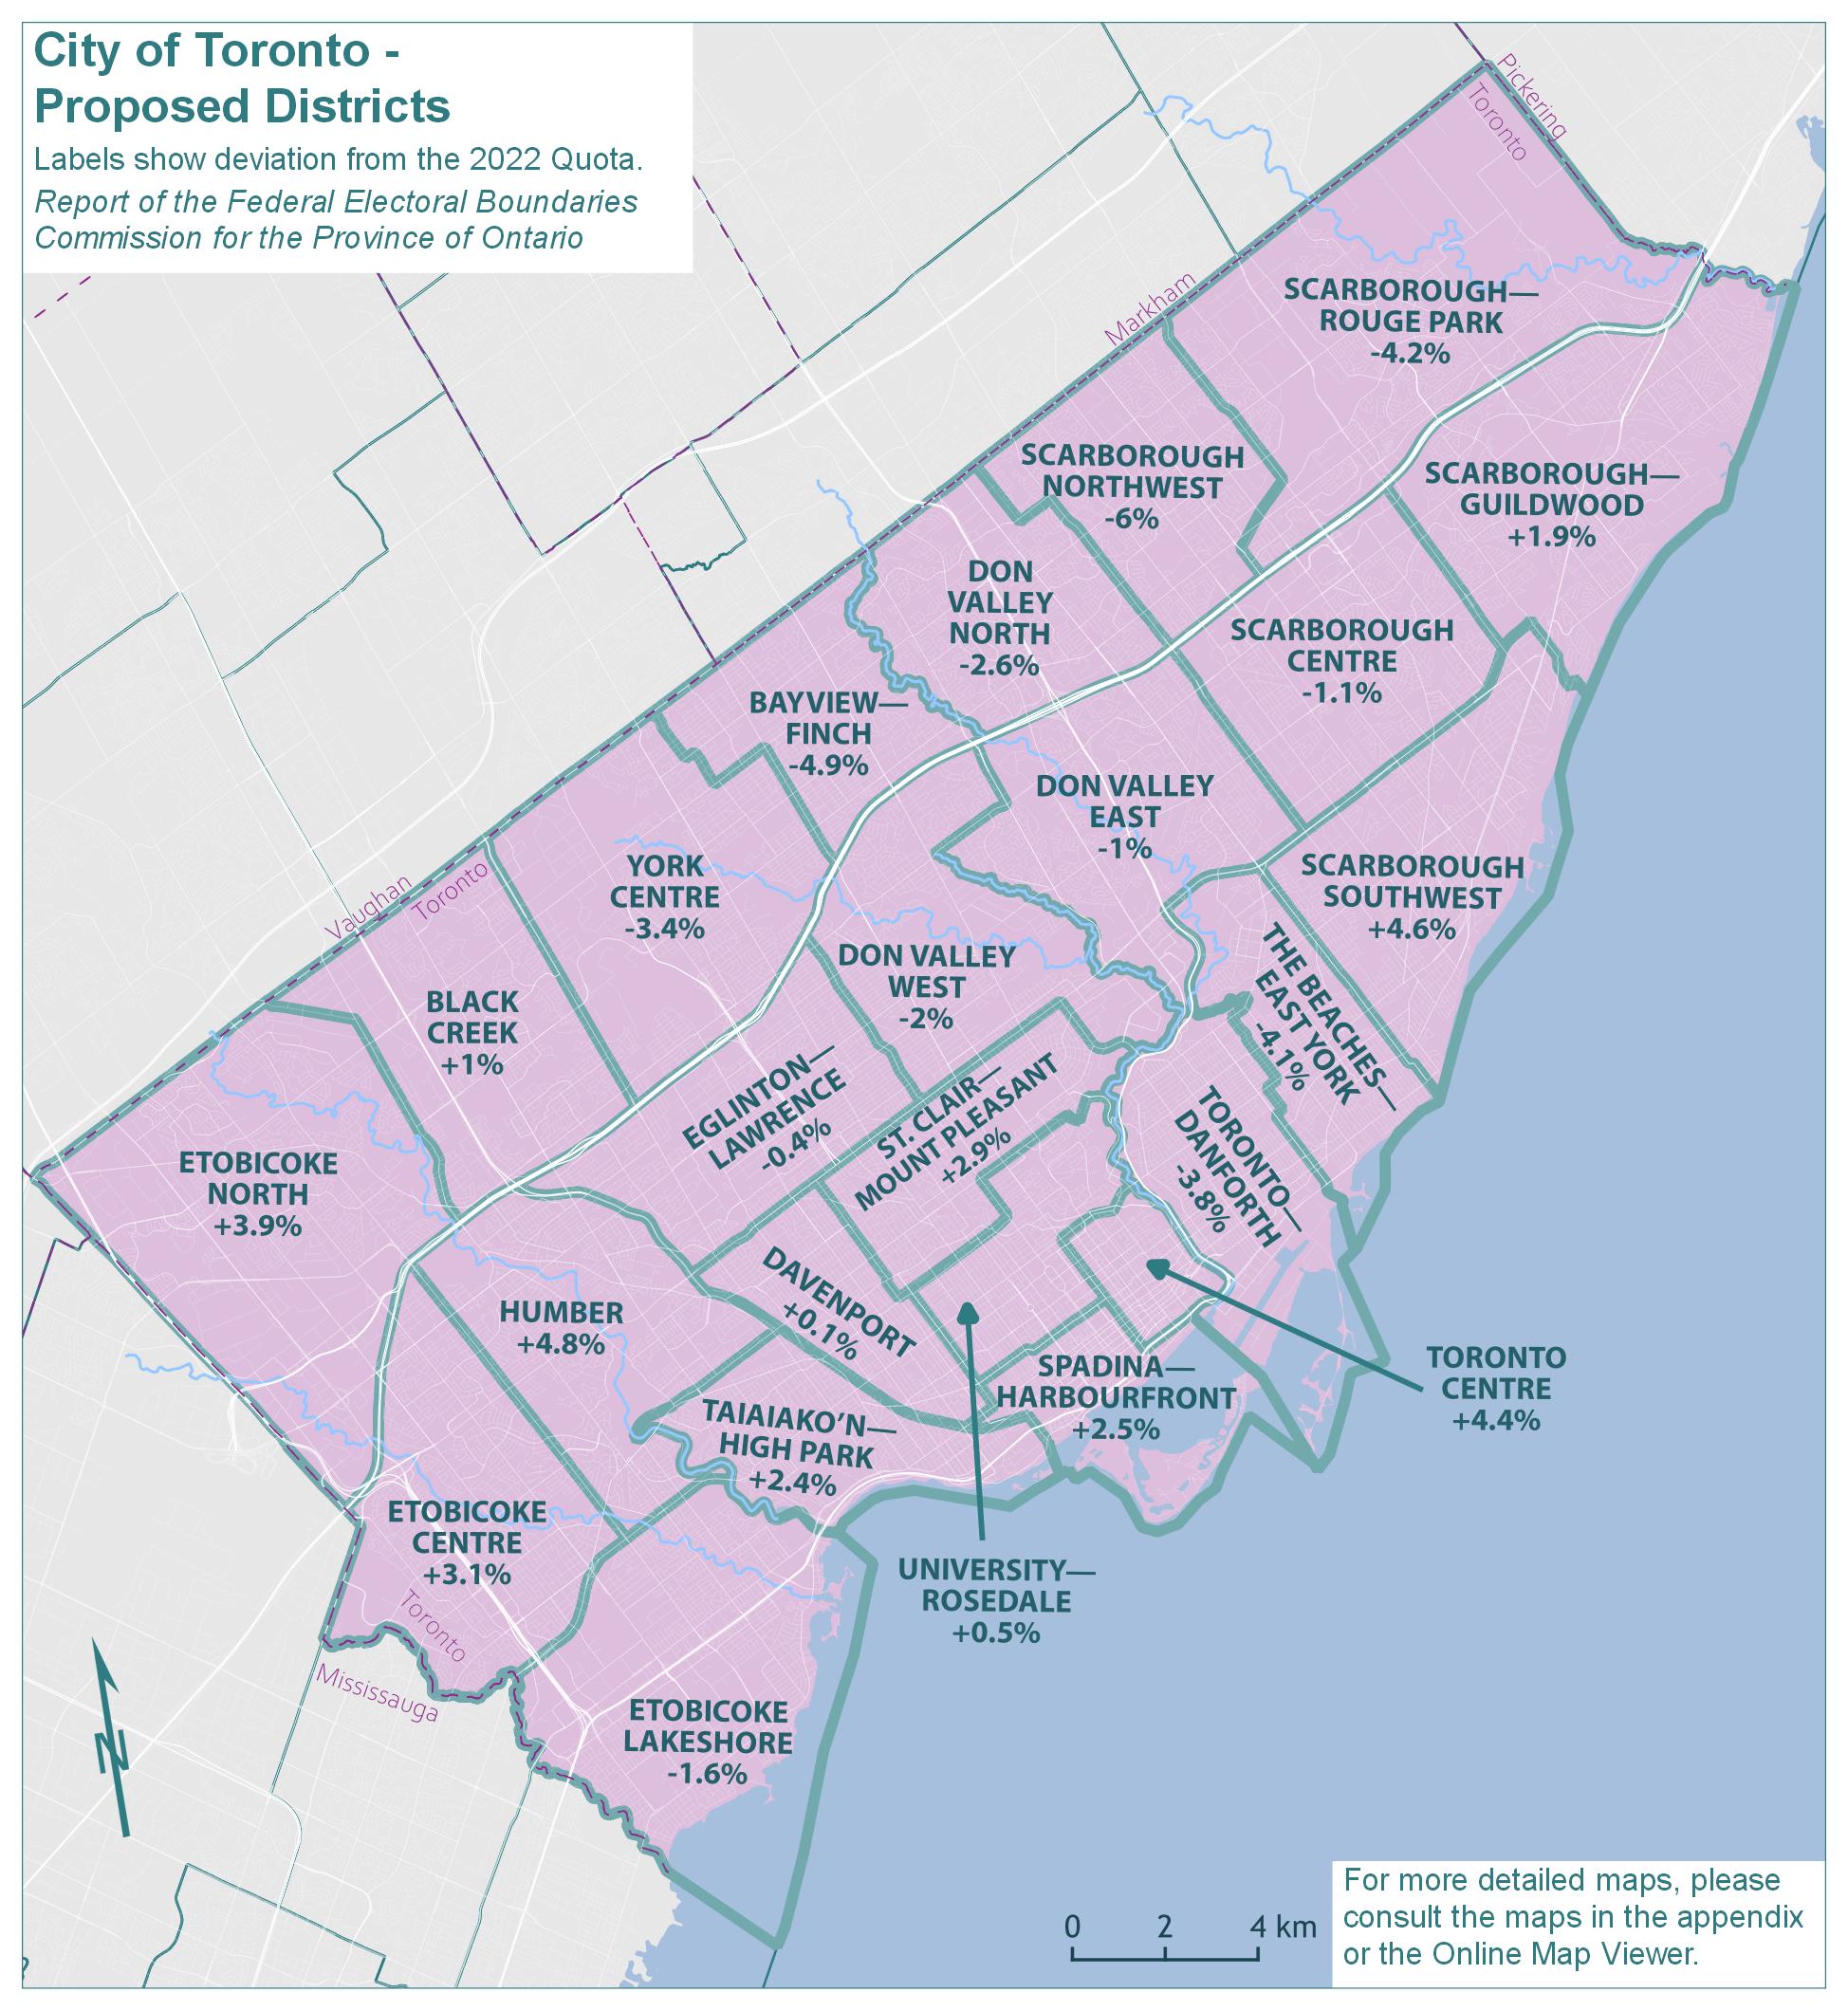
Text version of "City of Toronto - Proposed Districts"
Labels show deviation from the 2022 Quota.
Report of the Federal Electoral Boundaries Commission for the Province of Ontario
For more detailed maps, please consult the maps in the appendix or the Online Map Viewer.
| Electoral district | Deviation |
|---|---|
| Bayview—Finch | -4.9% |
| Black Creek | 1.0% |
| Davenport | 0.1% |
| Don Valley East | -1.0% |
| Don Valley North | -2.6% |
| Don Valley West | -2.0% |
| Eglinton—Lawrence | -0.4% |
| Etobicoke Centre | 3.1% |
| Etobicoke Lakeshore | -1.6% |
| Etobicoke North | 3.9% |
| Humber | 4.8% |
| Scarborough Centre | -1.1% |
| Scarborough—Guildwood | 1.9% |
| Scarborough Northwest | -6.0% |
| Scarborough—Rouge Park | -4.2% |
| Scarborough Southwest | 4.6% |
| Spadina—Harbourfront | 2.5% |
| St. Clair—Mount Pleasant | 2.9% |
| Taiaiako’n—High Park | 2.4% |
| The Beaches—East York | -4.1% |
| Toronto Centre | 4.4% |
| Toronto—Danforth | -3.8% |
| University—Rosedale | 0.5% |
| York Centre | -3.4% |
City of Toronto - Final Districts
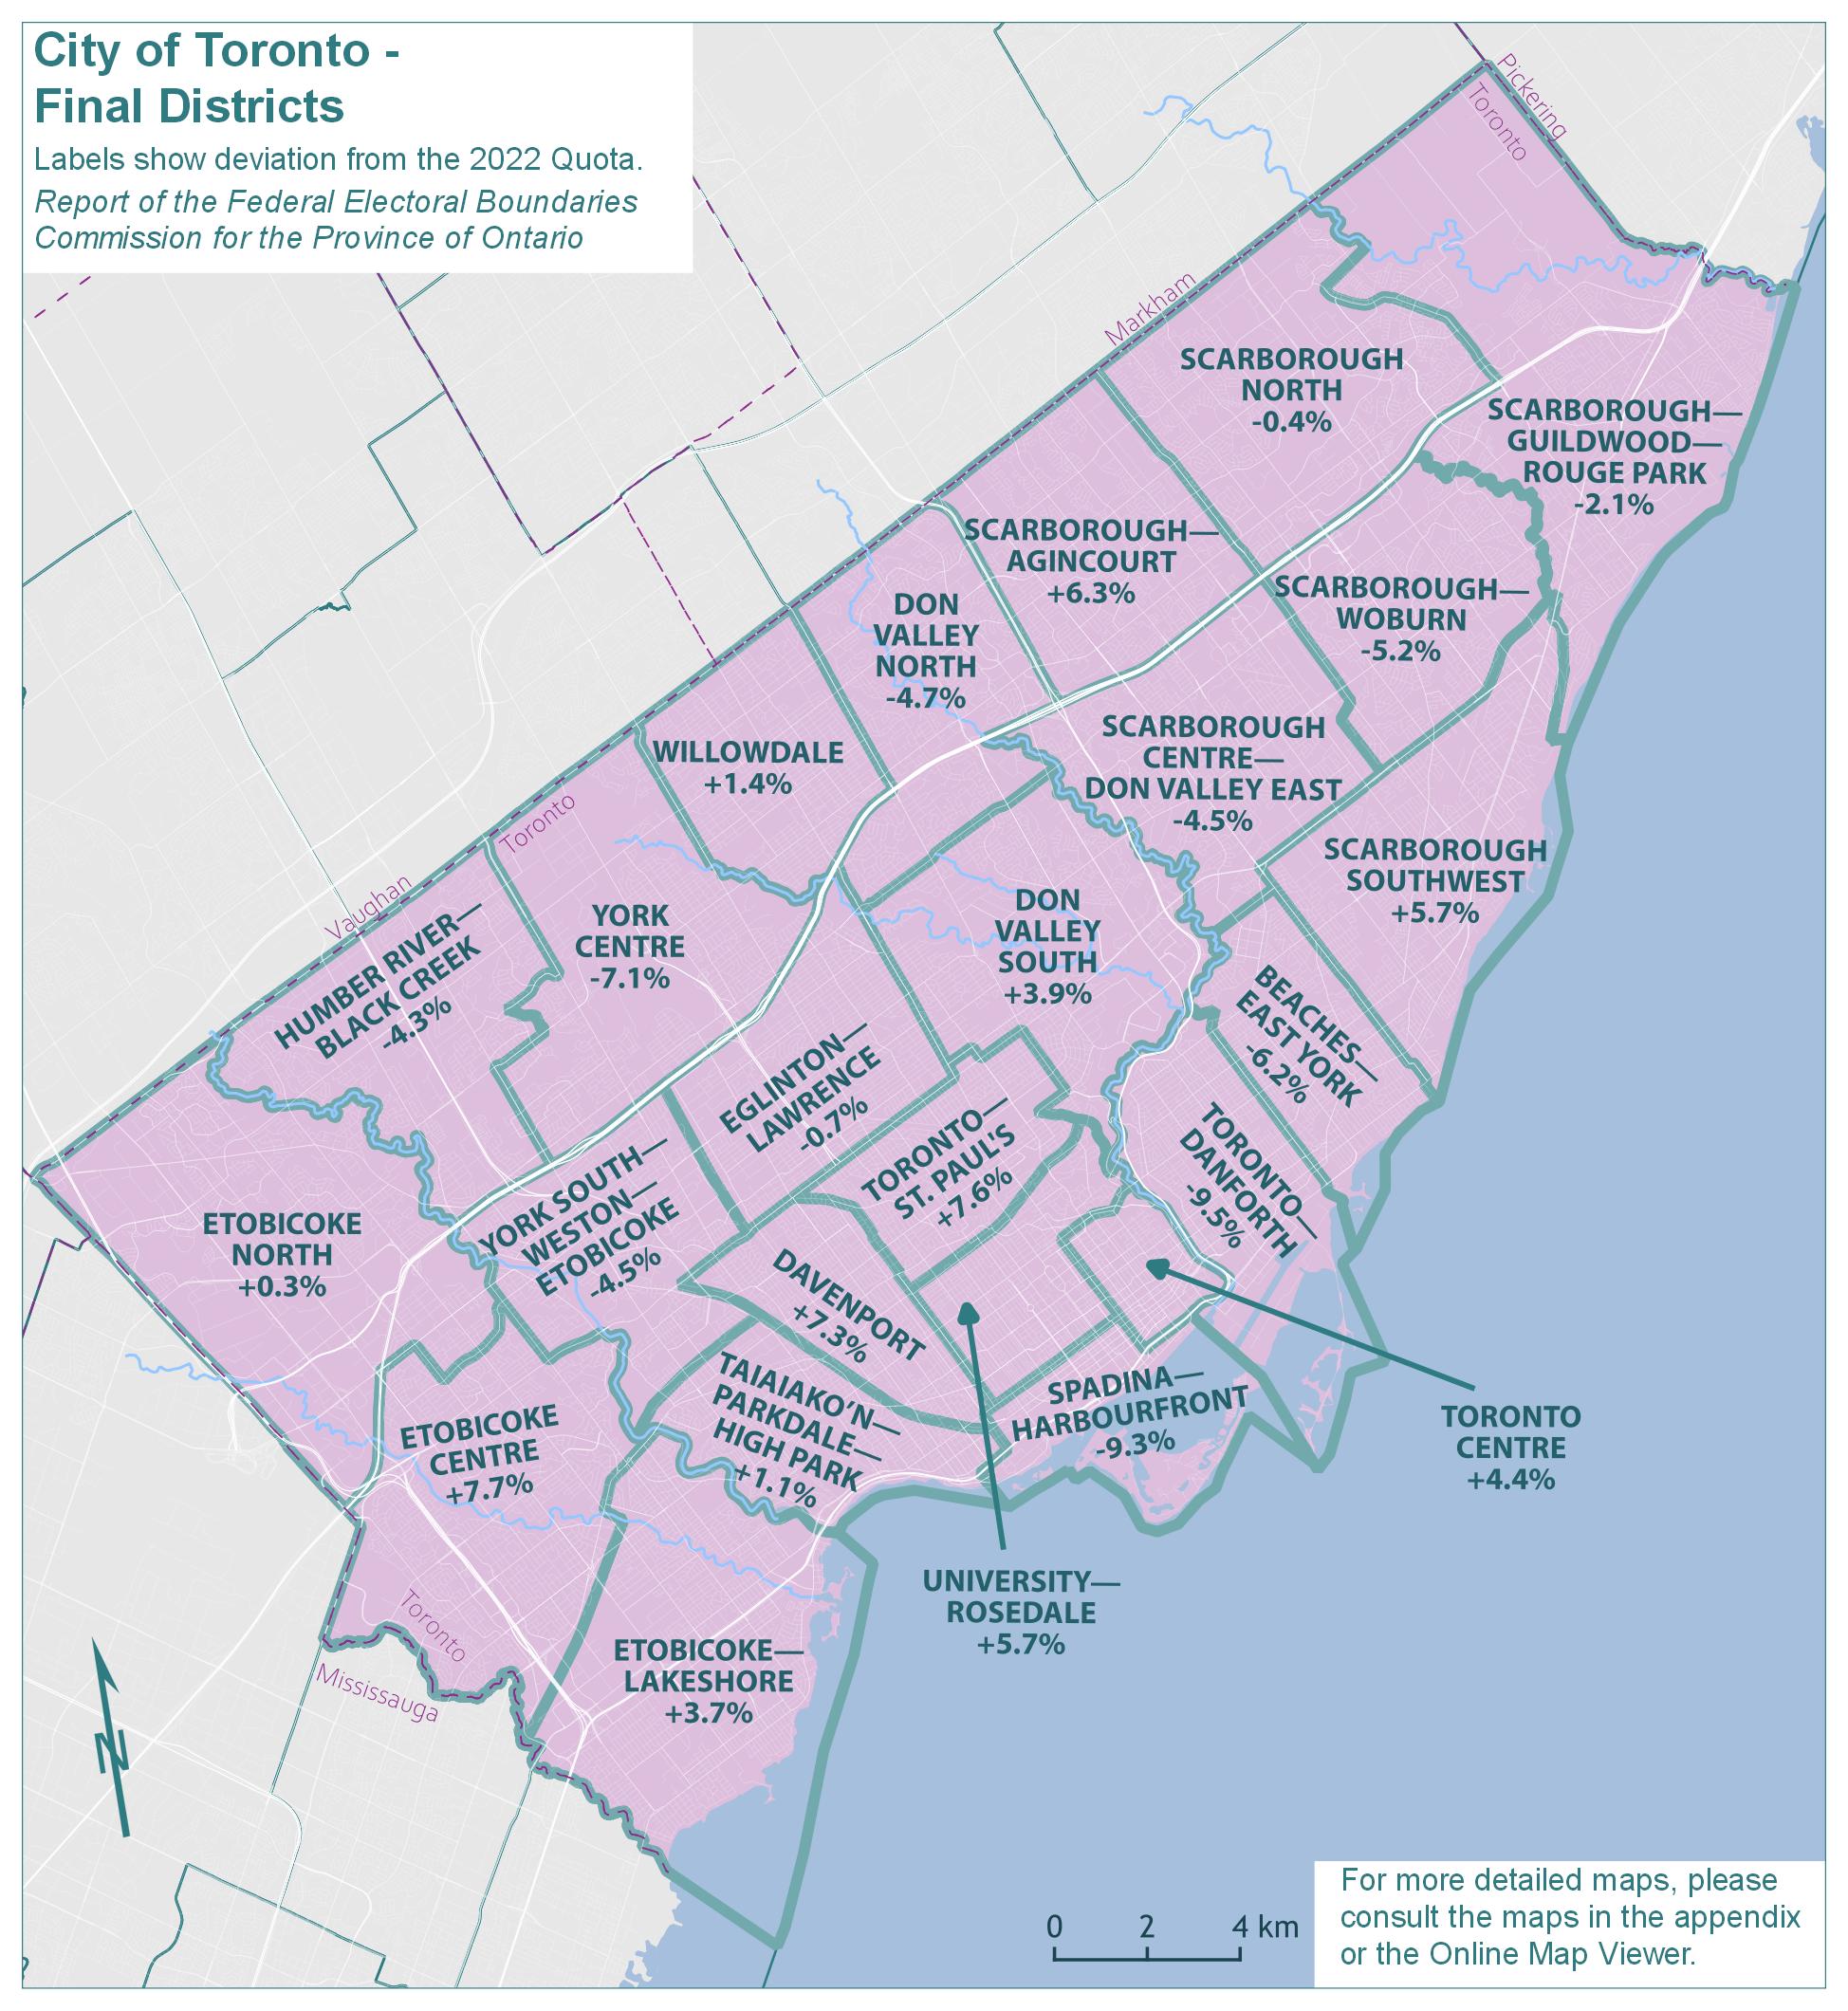
Text version of "City of Toronto - Final Districts"
Labels show deviation from the 2022 Quota.
Report of the Federal Electoral Boundaries Commission for the Province of Ontario
For more detailed maps, please consult the maps in the appendix or the Online Map Viewer.
| Electoral district | Deviation |
|---|---|
| Beaches—East York | -6.2% |
| Davenport | 7.3% |
| Don Valley North | -4.7% |
| Don Valley South | 3.9% |
| Eglinton—Lawrence | -0.7% |
| Etobicoke Centre | 7.7% |
| Etobicoke North | 0.3% |
| Etobicoke—Lakeshore | 3.7% |
| Humber River—Black Creek | -4.3% |
| Scarborough Centre—Don Valley East | -4.5% |
| Scarborough North | -0.4% |
| Scarborough Southwest | 5.7% |
| Scarborough—Agincourt | 6.3% |
| Scarborough—Guildwood—Rouge Park | -2.1% |
| Scarborough—Woburn | -5.2% |
| Spadina—Harbourfront | -9.3% |
| Taiaiako’n—Parkdale—High Park | 1.1% |
| Toronto Centre | 4.4% |
| Toronto—Danforth | -9.5% |
| Toronto—St. Paul's | 7.6% |
| University—Rosedale | 5.7% |
| Willowdale | 1.4% |
| York Centre | -7.1% |
| York South—Weston—Etobicoke | -4.5% |
The population of Toronto grew by 6.9%, from 2,615,060 in 2011 to 2,794,356 in 2021. The remainder of Ontario grew by 11.7% in the same period.
The existing 25 electoral districts in Toronto would have an average 2021 population of 111,774 — a figure that falls 4.1% below the Quota of 116,590. Furthermore, as indicated by the range of deviations relative to the 2022 Quota (40.3 percentage points), there are substantial disparities in the population size of districts across the City of Toronto. The populations and deviations from the Quota for the existing electoral districts are shown in Table 2A.
| Electoral Districts | Population – 2011 | Deviation from Quota – 2012 | Population – 2021 | Deviation from Quota – 2022 |
|---|---|---|---|---|
| Beaches—East York | 107,084 | +0.82% | 109,359 | -6.20% |
| Davenport | 102,360 | -3.63% | 105,946 | -9.13% |
| Don Valley East | 93,007 | -12.43% | 95,039 | -18.48% |
| Don Valley North | 103,073 | -2.96% | 113,663 | -2.51% |
| Don Valley West | 99,820 | -6.02% | 101,959 | -12.55% |
| Eglinton—Lawrence | 113,150 | +6.53% | 115,832 | -0.65% |
| Etobicoke Centre | 114,910 | +8.19% | 118,483 | +1.62% |
| Etobicoke—Lakeshore | 115,437 | +8.68% | 141,751 | +21.58% |
| Etobicoke North | 117,601 | +10.72% | 116,003 | -0.50% |
| Humber River—Black Creek | 108,198 | +1.87% | 111,593 | -4.29% |
| Parkdale—High Park | 105,103 | -1.05% | 106,750 | -8.44% |
| Scarborough—Agincourt | 104,499 | -1.61% | 104,423 | -10.44% |
| Scarborough Centre | 108,826 | +2.46% | 113,104 | -2.99% |
| Scarborough—Guildwood | 101,914 | -4.05% | 103,449 | -11.27% |
| Scarborough North | 101,080 | -4.83% | 94,717 | -18.76% |
| Scarborough—Rouge Park | 102,646 | -3.36% | 102,254 | -12.30% |
| Scarborough Southwest | 106,733 | +0.49% | 111,994 | -3.94% |
| Spadina—Fort York | 82,480 | -22.35% | 136,213 | +16.83% |
| Toronto Centre | 93,971 | -11.53% | 119,901 | +2.84% |
| Toronto—Danforth | 104,017 | -2.07% | 105,472 | -9.54% |
| Toronto—St. Paul's | 103,983 | -2.10% | 116,953 | +0.31% |
| University—Rosedale | 98,605 | -7.16% | 106,216 | -8.90% |
| Willowdale | 109,680 | +3.26% | 118,218 | +1.40% |
| York Centre | 100,277 | -5.59% | 108,307 | -7.10% |
| York South—Weston | 116,606 | +9.78% | 116,757 | +0.14% |
| Average | 104,602 | -1.52% | 111,774 | -4.13% |
| Range (most populous to least populous) | 35,121 | 33.07 pp | 47,034 | 40.34 pp |
pp = percentage points
The Commission noted that this overrepresentation in Toronto has emerged due to uneven population growth between Toronto and surrounding areas, which is expected to continue or increase in the future.
The Commission heard several submissions opposing the reduction of the number of districts in Toronto. A large share of these submissions argued that unique features of Toronto — namely its highly diverse population, its economic centrality, and its rapid growth — necessitated maintaining the current number of constituencies. In the Commission's view, these arguments apply with equal or greater weight to constituencies surrounding Toronto, which are on average faster-growing, similarly diverse, and economically dynamic.
As a result, the Commission concluded that the districts in Toronto be reduced by one.
This reduction, together with the obligation to address the wide population disparities of electoral districts within the City of Toronto, has required shifting many boundaries.
In the proposal, the most significant changes fell in the eastern portion of the City of Toronto, in the historical City of Scarborough. Here, deviations below the Quota were most pronounced. This area, historically described as lying to the east of Victoria Park Avenue, was reduced from six districts to five. This change affected the entire city as district boundaries were generally shifted eastward to generate greater population equality. Boundaries were also shifted to fix the excessively large deviations in Spadina—Fort York and Etobicoke—Lakeshore.
Several district names were changed to better describe their locations or reflect the neighbourhoods and communities that comprise these proposed reconfigured districts.
With 24 proposed districts, the average population in each proposed district was 116,432. The maximum deviation from the Quota was 6%. The populations and deviations from the Quota in the proposed redistribution plan are shown in Table 2B.
| Electoral Districts | Population – 2021 | Deviation from Quota – 2022 |
|---|---|---|
| Bayview—Finch | 110,908 | -4.87% |
| Black Creek | 117,740 | +0.99% |
| Davenport | 116,728 | +0.12% |
| Don Valley East | 115,456 | -0.97% |
| Don Valley North | 113,537 | -2.62% |
| Don Valley West | 114,229 | -2.03% |
| Eglinton—Lawrence | 116,139 | -0.39% |
| Etobicoke Centre | 120,157 | +3.06% |
| Etobicoke Lakeshore | 114,714 | -1.61% |
| Etobicoke North | 121,107 | +3.87% |
| Humber | 122,220 | +4.83% |
| Scarborough Centre | 115,260 | -1.14% |
| Scarborough—Guildwood | 118,754 | +1.86% |
| Scarborough Northwest | 109,568 | -6.02% |
| Scarborough—Rouge Park | 111,713 | -4.18% |
| Scarborough Southwest | 121,947 | +4.59% |
| Spadina—Harbourfront | 119,497 | +2.49% |
| St. Clair—Mount Pleasant | 119,935 | +2.87% |
| Taiaiako’n—High Park | 119,421 | +2.43% |
| The Beaches—East York | 111,805 | -4.10% |
| Toronto Centre | 121,703 | +4.39% |
| Toronto—Danforth | 112,119 | -3.83% |
| University—Rosedale | 117,119 | +0.45% |
| York Centre | 112,580 | -3.44% |
| Average | 116,432 | -0.14% |
| Range (most populous to least populous) | 12,652 | 10.85 pp |
pp = percentage points
The Commission's proposed redistribution plan for Toronto's districts was widely criticized by elected officials, civic organizations, and the general public.
Focusing on Scarborough, several submitters noted that Scarborough has a very high share of immigrants and visible minorities. This is a fact borne out in the recent 2021 Census data. As such, it was argued that it was especially inappropriate to eliminate a Scarborough district.
It was also pointed out that Scarborough has a unique identity. The old municipal boundary on Victoria Park Avenue is a very important landmark to the residents of Scarborough. It was argued that it was inappropriate to move areas of Scarborough into districts where the majority of the population is drawn from districts in the historical boundaries of North York.
It was further noted that many residents of Scarborough feel they have a history of being underrepresented by various levels of government. The Commission received many submissions about the forced municipal amalgamation in 1998 which Scarboroughians overwhelmingly voted against in a referendum; the lack of subway service; and the relatively poorer state of Scarborough's hospitals. In short, the Commission's redistribution plan was seen as another act against a part of Toronto which feels it has suffered a long series of setbacks and disappointments from governments of all levels.
The Commission also received submissions criticizing its proposed plan in the remainder of Toronto. It was frequently commented that the boundary changes were unwarranted and excessive in parts of the City where the existing district's deviations were already close to the Quota. It was further pointed out that the proposed districts split up several long-established neighbourhoods.
Based on this criticism, the Commission has significantly reconfigured its plan for Toronto. Instead of eliminating a district in Scarborough, the commission is merging the existing district of Don Valley East into Don Valley North, Don Valley West (which is being renamed Don Valley South), and Scarborough Centre (renamed Scarborough Centre—Don Valley East). We note that Don Valley East was also substantially below the Quota.
There are two main advantages to this new approach.
First, it allows the Commission to maintain six districts that are mostly based in Scarborough. While the final districts of Scarborough Centre—Don Valley East and Scarborough—Agincourt both cross over Victoria Park Avenue, the majority of residents of these districts are still in the former City of Scarborough. In Scarborough Centre—Don Valley East, 61,400 of its residents live east of Victoria Park Avenue, making up 55% of the district. In Scarborough—Agincourt, 104,400 of the residents live east of Victoria Park Avenue, making up 84% of the district.
Secondly, the cascading effects of eliminating a district are constrained to the eastern portion of the City. In the proposal, a district in the far eastern edge of the City was eliminated, and the majority of Toronto's districts were shifted eastward in compensation. In the final boundaries, Don Valley East is being merged into neighbouring districts with large negative deviations from the Quota. This constrains the major changes to those districts in the eastern half of the City and allows the remainder of the City to remain very close to the existing boundaries. In fact, fivefootnote 1 of Toronto's 24 final districts have been returned to their existing boundaries.
The other districts have received minor changes that do not substantially change their layout or overall configuration.
Many proposed names have also been changed back to their existing names, representing the fact that in our final redistribution plan, we have imposed only minor changes in these districts.
In developing the plan for the final boundaries, the Commission discussed at length the issue of Victoria Park Avenue and the former City of Scarborough. The idea of using Victoria Park Avenue from Toronto's northern boundary to Lake Ontario was considered. In this layout, Scarborough could receive either five or six districts. The Commission did not feel that either option was reasonable.
Scarborough's population is 629,941. In a five district Scarborough scenario, the average deviation from the Quota would be +8%. While this is within 10% from the Quota, this would have the unfair impact of eliminating a district exclusively in Scarborough. By moving the boundaries of two Scarborough-based districts across Victoria Park Avenue, the loss of a district is shared between Scarborough and the rest of Toronto.
In a six Scarborough district scenario, the Scarborough districts would have an average deviation of -10% from the Quota. This would unfairly reduce representation in the remainder of Toronto. This would also have the unfavourable effect of forcing large scale changes to the remainder of Toronto's districts.
The Commission has thus concluded that it is necessary to cross Victoria Park Avenue.
In developing its final plan for Toronto as a whole, the Commission endeavours to use major geographical features such as railroads, rivers, ravines, and major roads.
The Commission received some submissions suggesting that ravines and rivers should not be used as boundaries in order to keep parks, ecological areas, and protected areas in the same district. However, the Commission noted that rivers and ravines are clearly discernible boundaries between neighbourhoods. The Humber River in particular has been a major boundary for Toronto's former municipalities, municipal wards, and electoral districts. Further, in terms of protecting ecologically fragile areas, it seems advantageous that residents of two districts would identify with such features, rather than just one.
The Commission relies on the City of Toronto's 158 official neighbourhoods and communities (Neighbourhoods & Communities – City of Toronto) in drawing the final boundaries (hereafter referred to as official neighbourhoods, and indicated in parentheses by their official number). We follow official neighbourhood boundaries, and keep neighbourhoods and communities whole, where possible.
The Commission has also maintained the existing district boundaries where possible.
In Scarborough—Guildwood—Rouge Park, the final plan restores a district that resembles the existing district. Similar to the existing district, the final district spans over Highway 401 and covers the eastern extremity of the City of Toronto. Given that the existing district had a deviation of -12.3% and its two neighbouring districts had deviations of -18.8% and -11.3%, the existing district could not be restored exactly. Starting in the North, the western boundary has been drawn along Rouge River, the power line running north of the Morningside Heights neighbourhood, and down Morningside Avenue
South of Highway 401, the boundary follows Highland Creek to the GO Transit rail line. South of the GO Transit rail line, the boundary deviates from the official neighbourhood boundaries based on a joint written submission from the Guildwood Village Community Association and the Cliffcrest Scarborough Village Southwest Residents Association. This submission gave clearly laid-out details showing how the City's official neighbourhood, Census tracts, and proposed electoral districts do not properly account for the local street network and topography, which includes an escarpment that divides these communities in half. The final boundaries have been drawn to reflect the escarpment and local travel patterns explained by these two neighbourhood associations.
Scarborough Southwest's eastern boundaries have been drawn to reflect the above-referenced submission and also to keep Scarborough Village whole. The remainder of the district matches the existing and proposed boundaries.
Scarborough—Guildwood's eastern and western boundaries have both been shifted towards the west from the proposed and existing boundaries. These shifts were done to reflect population equality and to draw boundaries on clear, straight, easily-explained features. As the new boundaries no longer include the Guildwood Village, the district has been renamed Scarborough—Woburn.
In Scarborough North, the eastern boundary has been drawn as described above. The western boundary has been restored on Midland Avenue, matching its location in the existing boundaries. Several submitters urged the Commission to reconsider the proposed boundary on McCowan Road. Submissions to this effect were received from many individuals, community groups, and elected representatives.
In Scarborough—Agincourt, the eastern boundary was restored to the existing district boundary on Midland Avenue, as described above. The western boundary was moved to Highway 404. While the Commission acknowledges that many submitters would prefer the boundary on Victoria Park Avenue, the infeasibility of this has been discussed above. The Commission has chosen Highway 404 because it is a clear, discernible boundary. As previously noted, this extends the district into North York. However, this district remains primarily based in Scarborough as 84% of the residents live east of Victoria Park Avenue.
The name of this district has been returned to the existing name of Scarborough—Agincourt. Many submissions discussed the important identity and long history of Agincourt, going back to its founding in 1858. The Commission appreciates the importance of this historic identity and agrees that Agincourt should remain as an electoral district and also as a name.
Scarborough Centre—Don Valley East's boundaries also extend over Victoria Park Avenue to include parts of North York. With 55% of this district still residing in the former City of Scarborough, this makes for a Scarborough-majority district.
The Commission had initially deliberated on drawing the western boundary on the Don Valley Parkway (similar to Scarborough—Agincourt). However, the boundary has been drawn on the East Don River. Based on public submissions from the residents of Wynford Drive and comments from elected officials, it was recognized that the official neighbourhood of Flemingdon Park (44) is better placed in Don Valley South. Using the East Don River as a boundary also keeps the official neighbourhoods of Victoria Village (43), Parkwoods-O'Connor Hills (149), and Fenside-Parkwoods (150) whole.
The proposed southern boundary for Scarborough Centre and The Beaches—East York was drawn on Eglinton Avenue. However, the Commission was encouraged to return the boundary to Sunrise Avenue, as in the existing districts. This was based on concerns surrounding development (spurred by the new LRT line) on both sides of Eglinton Avenue. In the final plan, the Commission has chosen to return the southern boundary to Sunrise Avenue.
The districts of Beaches—East York and Toronto—Danforth have been returned to their existing boundaries, with one small exception. In the southwestern corner of Toronto—Danforth, the boundary has been shifted to the Gardiner Expressway to simplify the boundary.
The proposal had shifted the boundary between these two districts to Glebemount Avenue and Hillingdon Avenue. Submissions were mixed on this idea. The Commission ultimately decided that keeping the boundary on Coxwell Avenue is the preferred option as this matches the historical configuration and also represents a simple, easily-explained boundary.
The proposed district of The Beaches–East York was extended to Eglinton Avenue and also included the eastern portions of the official neighbourhood of Flemingdon Park (44). As discussed above, the final boundaries of Beaches—East York have been returned to match the existing boundary.
In the proposal, the Commission had also changed the name of the existing district to The Beaches—East York. This was done on the recommendation of the Geographical Names Board of Canada, which has the official name listed as The Beaches.
The Commission has heard from several people associated with all the main political parties that district name changes force a burdensome administrative hassle on the party's infrastructure, staff, and volunteers. The Commission recognizes this and has restored the existing name of Beaches—East York (as we have done in other districts).
Don Valley North's boundary has been considerably redrawn compared to both the existing and proposed districts. As previously described, the eastern boundary was shifted from Victoria Park Avenue to Highway 404. The majority of the western boundary has been returned to the existing boundary of Bayview Avenue. The major change to this district is the expansion to include the official neighbourhood of St. Andrew-Windfields (40). This change was made as a result of the merger of Don Valley East into its neighbouring districts.
The Commission recognizes that it is preferable to keep the district entirely north of Highway 401. The Commission also acknowledges that this is a significant change from the proposed or existing boundaries and that the public has no opportunity to submit feedback on this change. However, the Commission sees no other option. In adding this area to Don Valley North, the Commission has respected the official neighbourhoods. The entirety of St. Andrew-Windfields (40), including the segment north of Old York Mills Road, has been incorporated into Don Valley North.
Don Valley South has also seen considerable changes since the proposal. This is in account of the merger of Don Valley East into neighbouring districts. The Commission was also notified by the submissions that it made several errors in this part of Toronto.
As part of the merger of Don Valley East into neighbouring districts, Don Valley South's eastern boundary has been placed on the East Don River. This allows the official neighbourhoods of Flemingdon Park (44) and Banbury-Don Mills (42) to remain whole.
The northern boundary has been moved from Highway 401 to York Mills Road and Old York Mills Road. The Commission recognizes that Highway 401 is a preferable boundary. However, it is impossible to keep the boundary on Highway 401 while respecting the principle of population equality and limiting changes to neighbouring districts. The Commission is comfortable with the boundary on York Mills Road and Old York Mills Road as this is a major artery and also matches the official neighbourhood boundaries.
The Commission's proposed boundary through the community of Leaside was heavily criticized. Leaside had been split between the proposed districts of Don Valley West and St. Clair—Mount Pleasant. The Commission received dozens of submissions from members of the public urging the Commission to make Leaside whole. The Commission found these arguments persuasive. Leaside has been reunited in its entirety in the district of Don Valley South.
The western border matches the existing district of Don Valley West's boundary with one major modification. South of Eglinton Avenue, the final boundary will follow Bayview Avenue instead of Mount Pleasant Road. This respects a well-researched submission from the South Eglinton Davisville Residents' Association requesting that the community of Davisville remain whole.
In the extreme south of Don Valley South, the boundary has been extended to the Bayview-Bloor interchange. This incorporates the southern portion of the official neighbourhood of Leaside-Bennington (56) which was previously in University—Rosedale.
University—Rosedale has received considerable changes since the proposal and the existing boundaries. The southern boundary has been moved from Dundas Street to Queen Street. Submissions informed the Commission that Queen Street was preferable to Dundas Street for two reasons. First, Queen Street is the dividing line between high-density condo towers and lower- to medium-density residential units. Second, and more importantly, Dundas Street runs through the centre of downtown Chinatown. Placing the boundary on Queen Street allows Chinatown to remain whole.
The eastern boundary of University—Rosedale will remain on Yonge Street, as it was in the proposal. The Commission feels that this is an improvement over the existing boundary as it follows a simple, straight line that matches the official neighbourhood boundaries. This also places the Chinese community in between Bay Street and Yonge Street, which was previously in Toronto Centre, into University—Rosedale along with the rest of Chinatown.
In the areas around Deer Park and Moore Park, the Commission has made some changes from the proposal. The Commission received submissions about splitting both of these communities. In order to make these communities whole, achieve population parity, and make clear, easily understood boundaries, it was decided to draw the northern boundary along the CP rail line.
The Commission's final boundaries for Toronto—St. Paul's resemble those of the existing district, with some changes. The boundaries for this district had been considerably altered in the proposal, and it had also been renamed to St. Clair—Mount Pleasant. Both the proposed boundaries and proposed name were ill-received by the public.
In the final plan, the name Toronto—St. Paul's matches that of the existing district. The Commission was informed in several submissions (from the MP, the residents of Christie Gardens Retirement Residence, and others) that there is a strong identity going back several decades around this name.
However, several changes to the district's borders have been made as a result of changes to neighbouring districts and the goal of achieving population parity. While the Commission has not followed the exact letter of the many submissions requesting a return to the status quo, we have attempted to comply with the spirit of these submissions in respecting the history, community, and identity of this district.
The Commission received two submissions from neighbourhood associations concerning this district. The first submission was from the South Eglinton Davisville Residents' Association. This association supported the proposed boundaries as it keeps the Davisville neighbourhood whole. A few submissions from individuals in the neighbourhood echoed this sentiment. This neighbourhood was wholly in Toronto—St. Paul's after the 2003 redistribution, but was split up after the 2013 redistribution. The Commission has placed Toronto—St. Paul's eastern boundary on Bayview Avenue, keeping all of Davisville in Toronto—St. Paul's.
The Commission also received several submissions concerning Deer Park, including from the Deer Park Residents Group. The proposed boundaries for St. Clair—Mount Pleasant had split Deer Park in half. The Commission agrees that Deer Park should be kept whole and has thus moved the southern boundary for Toronto—St. Paul's to the CP railway track.
The CP railway track forms the entirety of Toronto—St. Paul's southern boundary. As previously discussed, this means that Moore Park is being moved into Toronto—St. Paul's.
The small area in between Broadway Avenue and Eglinton Avenue and in between Yonge Street and Mount Pleasant Road was moved to Don Valley West in the proposal. However, due to other changes to the neighbouring districts, the Commission has had to put this area back into Toronto—St. Paul's. The Commission notes that placing this in Don Valley South would better reflect the official neighbourhood boundaries and make for a cleaner, straight boundary. However, this boundary has been returned to its existing configuration based on the need to maintain population equality.
For the western boundary of Toronto—St. Paul's, the boundary has been shifted back to the existing district boundary on Ossington Avenue and Winona Drive. The section north of Holland Park Avenue and Rogers Road was moved to Vaughan Road. The reason for using a slightly modified version of the existing boundary was to respect population equality. With the changes to the neighbouring districts, the proposed boundary was no longer feasible. The western boundary takes a diagonal on Vaughan Road in order to protect the integrity of Little Jamaica along Eglinton Avenue from Marlee Avenue to Dufferin Street.
Eglinton—Lawrence has been returned to its existing boundaries. Several submitters had requested that the Commission do this. The Commission felt that this was a reasonable request, given that the existing district had a deviation of only -0.7% from the Quota.
The final plan for Toronto Centre matches the proposed district. This represents minor changes to the existing districts. The western and northern boundary has been moved to Yonge Street and Bloor Street. This simplifies the boundaries by placing them on major streets, and matches the official neighbourhood boundaries. In the south, the boundary has been shifted to the Gardiner Expressway. This was positively received by submitters, who appreciated that the St. Lawrence Market neighbourhood and the Distillery District were made whole. The Gardiner Expressway also makes for a clear boundary.
Spadina—Fort York grew by 53,733 people between the 2011 and 2021 Census, giving it a deviation from the Quota of +16.8%. This is the second largest population growth in Ontario. This necessitated large changes from the existing boundaries. The northern boundary has been shifted from Dundas Street to Queen Street. This allows downtown Chinatown to remain whole in University—Rosedale.
In the proposal, Liberty Village was moved from Spadina—Fort York to Taiaiako'n—High Park. Submissions were evenly split on this issue. In the end, the Commission decided to move this boundary to match the official neighbourhood on Atlantic Avenue. The Commission has also opted to retain the proposed name of Spadina—Harbourfront for this district.
Davenport has received minor changes since the proposal. The portions of the existing district south of Queen Street have been returned to Davenport. This keeps the official neighbourhood of Little Portugal (84) whole. The eastern boundary with Toronto—St. Paul's has been moved to the existing boundary, with a slight modification north of Rogers Road and Holland Park Avenue. This boundary has been moved to Vaughan Road in the interests of promoting population equality.
In the proposal, Parkdale—High Park's name was changed to Taiaiako'n—High Park. This was done in a spirit of reconciliation in recognition of the Haudenosaunee village and burial mounds on the site of High Park. While commenters generally appreciated and approved of using an Indigenous name, several people felt that removing Parkdale
from the name was inappropriate. The Commission was told that Parkdale had a strong identity and history. As was suggested by many submitters, the Commission has decided to change the name to Taiaiako'n—Parkdale—High Park.
As for Taiaiako'n—Parkdale—High Park's boundaries, the Commission received mixed feedback on the proposed boundary changes in both the southeast and in the north.
In the southeast, submissions were mixed on the appropriateness of moving Liberty Village into the proposed district of Taiaiako'n—High Park. The Commission has decided to place the boundary on Atlantic Avenue, representing a compromise between the existing boundary and the proposed boundary. Atlantic Avenue also has the benefit of matching the official neighbourhood boundaries. It also keeps Little Tibet whole inside Taiaiako'n—Parkdale—High Park.
The proposed district of Taiaiako'n—High Park's northern boundary was also unpopular. The Commission was told that St. Clair Avenue was a poor choice. Some submitters suggested that the boundary be returned to the railway tracks, where the existing boundary was placed. The Commission ultimately decided to use the high-tension powerline along Lavender Creek, as was argued by other submitters, allowing the Tibetan community to remain whole.
The proposed elimination of York South—Weston and the creation of Humber proved to be unpopular. The proposed district of Humber crossed the Humber River and incorporated portions of the existing districts of Etobicoke Centre and York South—Weston. Some submitters from the Etobicoke side supported this new district. It was seen as adding representation to Etobicoke, as Etobicoke was receiving an extra half seat. It was also pointed out that historically districts have crossed the Humber River.
However, submitters from the existing district of York South—Weston were highly critical of this decision. It was pointed out that the Humber River is a major boundary with very different communities on both sides of it. The western side of the river (the portions in the former City of Etobicoke) is much more affluent, while the portions on the eastern side of the Humber River have a much higher share of visible minorities, immigrants, renters, and lower average income.
Given that the final plan for the City of Toronto allows the Commission to keep many of the existing districts, a district largely resembling the existing district of York South—Weston has been restored. This district will be named York South—Weston—Etobicoke as a portion of the boundary still crosses the Humber River. The Commission has chosen to keep the official neighbourhood of Humber Heights-Westmount (8) in this district in the interests of population equality.
The existing district of Etobicoke—Lakeshore has a deviation from the Quota of +21.6%, necessitating changes in the area. In the proposal, the Commission opted to draw the boundary on Dundas Street and Bloor Street. While the boundary on Dundas Street was well-received, the boundary on Bloor Street was not. Submitters urged the Commission to keep the boundary on Dundas Street through the entirety of the district.
There were three concerns with the boundary on Bloor Street. First, the Kingsway Business Improvement Area is centred on Bloor Street. The Commission was encouraged not to split the Kingsway Business Improvement Area in half. The Commission was also informed that the official neighbourhood of Kingsway South (15) (between Dundas Street and Bloor Street) would be better suited in Etobicoke—Lakeshore. Finally, the neighbourhood of high-rise condo towers around Mabelle Avenue would also be better suited in Etobicoke—Lakeshore.
The Commission is unable to put both the Mabelle Avenue neighbourhoods and the Kingsway area into Etobicoke—Lakeshore, as this would give the district an unreasonably high deviation from the Quota. The Commission has returned the official neighbourhood of Kingsway South (15) to Etobicoke—Lakeshore. However, west of Mimico Creek, the Commission has opted to use the CP rail line as the boundary, leaving the Mabelle Avenue neighbourhoods and the other high-rise developments along Dundas Street in Etobicoke Centre.
In the proposal, the Commission had opted to drop the em dash (—
) from the name of Etobicoke Lakeshore. This was done because the em dash generally denotes when multiple cities, neighbourhoods, and locations are appended to district names. The em dash is generally not used when a name gives directional context. However, based on the feedback from political parties, the Commission recognizes that name changes can impose a burdensome task on political parties' infrastructure, staff, and volunteers. It was also pointed out that the term Lakeshore
is not merely providing directional context, but refers to literal places in this district, such as Lakeshore Village. Thus, the Commission has opted to return the em dash and restore the existing name of Etobicoke—Lakeshore.
For Etobicoke Centre, many of the areas that had been moved to the proposed district of Humber have been returned to Etobicoke Centre. The southern and eastern boundaries were modified as described above.
The northern boundary of the proposed district was on Highway 401. This received much support. However, in response to the other changes in this area, this boundary had to be moved south. The boundary was drawn on Dixon Road, Kipling Avenue, and The Westway. This configuration was chosen because it allows the official neighbourhood of Kingsview Village-The Westway (6) to remain whole, within Etobicoke North.
Etobicoke North's southern boundary was drawn as described above, allowing all the official neighbourhood of Kingsview Village-The Westway (6) to be added to the district. The Commission notes that much of this neighbourhood was in the existing district of Etobicoke North.
Etobicoke North's eastern boundaries were returned to its existing boundary on the Humber River. This allows the Commission to restore the existing boundaries for Humber River—Black Creek, York Centre, and Willowdale. In all three of these districts, the Commission had been informed that the proposal had inappropriately separated neighbourhoods and communities.
In Humber River—Black Creek, it was requested that the western boundary be returned to the Humber River so that the neighbourhoods of Humberlea, Humbermede and Humber Summit could be returned to the district. The Commission was also told of the importance of keeping the Jane and Finch neighbourhoods together in Humber River—Black Creek, as it had been in the existing and proposed districts.
In York Centre, the Commission heard that it was important to keep Downsview in a single district. The Commission was also urged to restore the boundary on Grandravine Drive. Downsview had been one of the main neighbourhoods in York Centre for several redistribution cycles, and the Commission was told that it was inappropriate to split up this community.
It was also stated that Yonge Street was a poor boundary between the proposed district of York Centre and Bayview—Finch, as Yonge Street splits up the Willowdale Business Improvement Area and the Willowdale neighbourhoods. There were also submissions encouraging the Commission to restore the name of Willowdale.
The Commission accepts all these submissions related to the districts north of Highway 401. These issues were resolved by restoring the existing boundaries and names for Humber River—Black Creek, York Centre, and Willowdale.
The names, populations and deviations from the Quota for the City of Toronto's final districts are shown in Table 2C.
| Electoral Districts | Population – 2021 | Deviation from Quota – 2022 |
|---|---|---|
| Beaches—East York | 109,359 | -6.20% |
| Davenport | 125,048 | +7.25% |
| Don Valley North | 111,122 | -4.69% |
| Don Valley South | 121,147 | +3.91% |
| Eglinton—Lawrence | 115,832 | -0.65% |
| Etobicoke Centre | 125,606 | +7.73% |
| Etobicoke—Lakeshore | 120,956 | +3.74% |
| Etobicoke North | 116,886 | +0.25% |
| Humber River—Black Creek | 111,593 | -4.29% |
| Scarborough—Agincourt | 123,969 | +6.33% |
| Scarborough Centre—Don Valley East | 111,377 | -4.47% |
| Scarborough—Guildwood—Rouge Park | 114,100 | -2.14% |
| Scarborough North | 116,177 | -0.35% |
| Scarborough Southwest | 123,232 | +5.70% |
| Scarborough—Woburn | 110,589 | -5.15% |
| Spadina—Harbourfront | 105,739 | -9.31% |
| Taiaiako’n—Parkdale—High Park | 117,873 | +1.10% |
| Toronto Centre | 121,703 | +4.39% |
| Toronto—Danforth | 105,472 | -9.54% |
| Toronto—St. Paul's | 125,438 | +7.59% |
| University—Rosedale | 123,244 | +5.71% |
| Willowdale | 118,218 | +1.40% |
| York Centre | 108,307 | -7.10% |
| York South—Weston—Etobicoke | 111,369 | -4.48% |
| Average | 116,432 | -0.14% |
| Range (most populous to least populous) | 20,134 | 17.27 pp |
pp = percentage points
Eastern Ontario
Eastern Ontario - Existing Districts
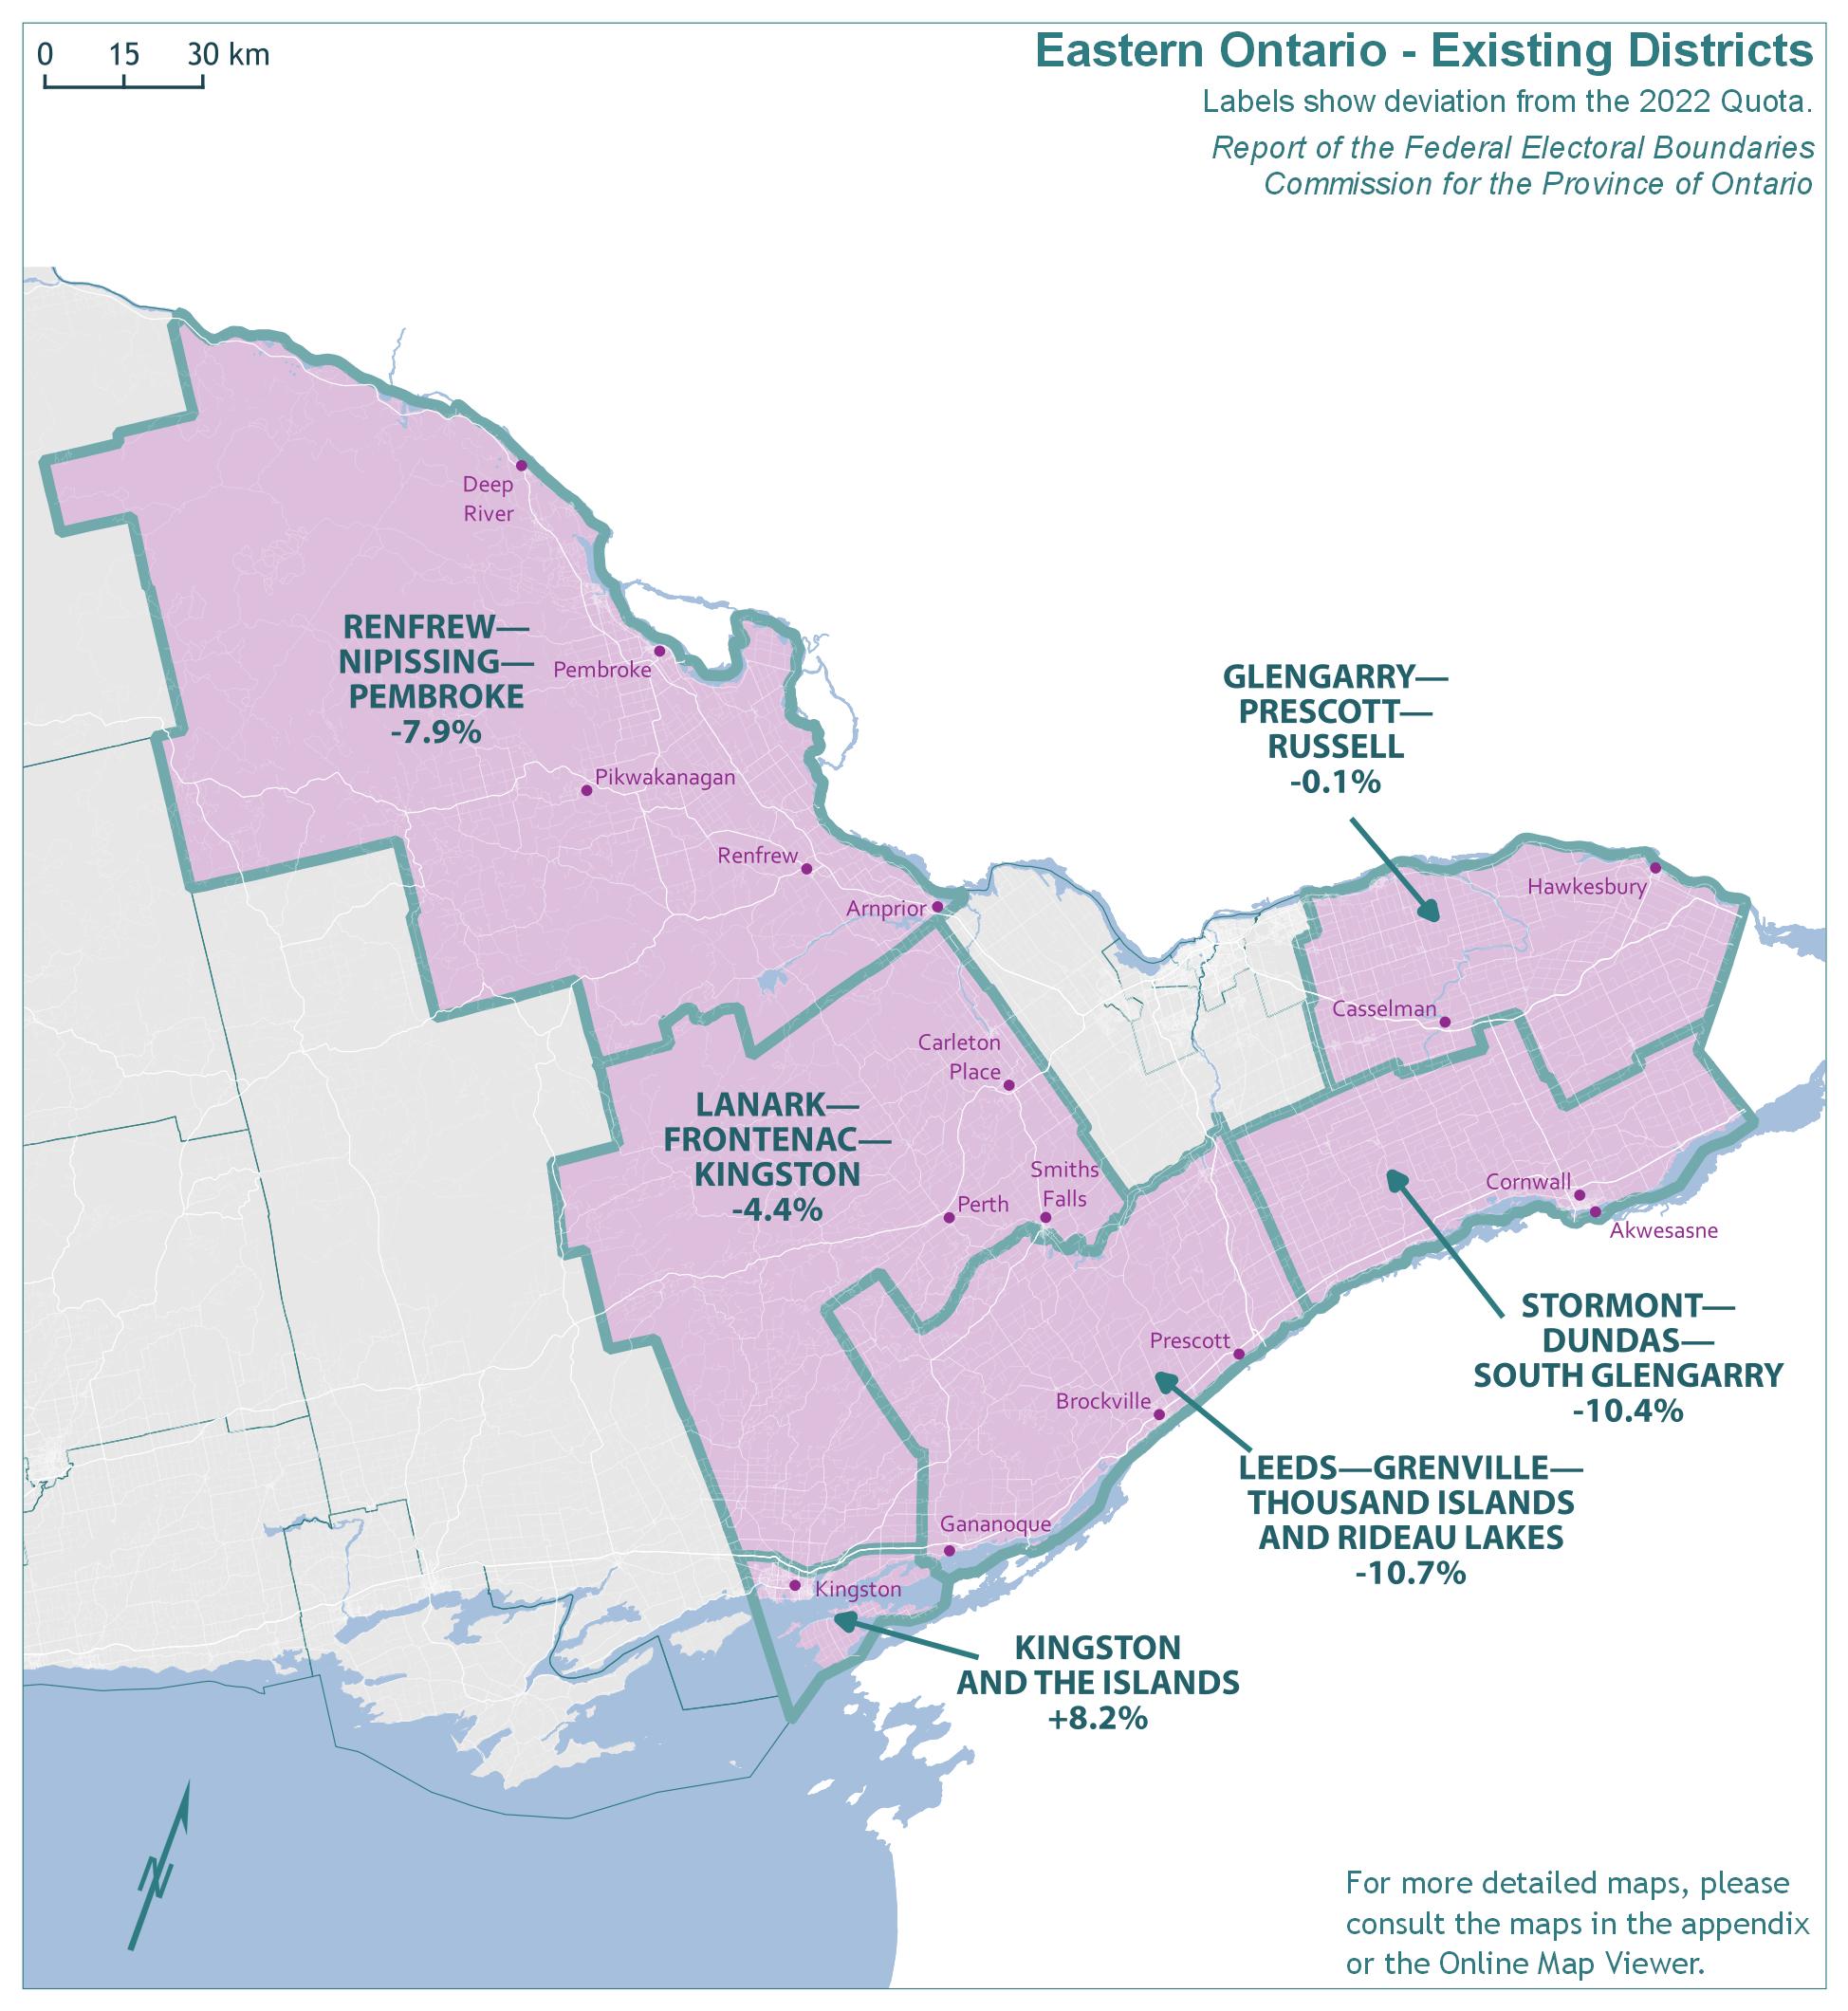
Text version of "Eastern Ontario - Existing Districts"
Labels show deviation from the 2022 Quota.
Report of the Federal Electoral Boundaries Commission for the Province of Ontario
For more detailed maps, please consult the maps in the appendix or the Online Map Viewer.
| Electoral district | Deviation |
|---|---|
| Glengarry—Prescott—Russell | -0.1% |
| Kingston and the Islands | 8.2% |
| Lanark—Frontenac—Kingston | -4.4% |
| Leeds—Grenville—Thousand Islands and Rideau Lakes | -10.7% |
| Renfrew—Nipissing—Pembroke | -7.9% |
| Stormont—Dundas—South Glengarry | -10.4% |
Eastern Ontario - Proposed Districts
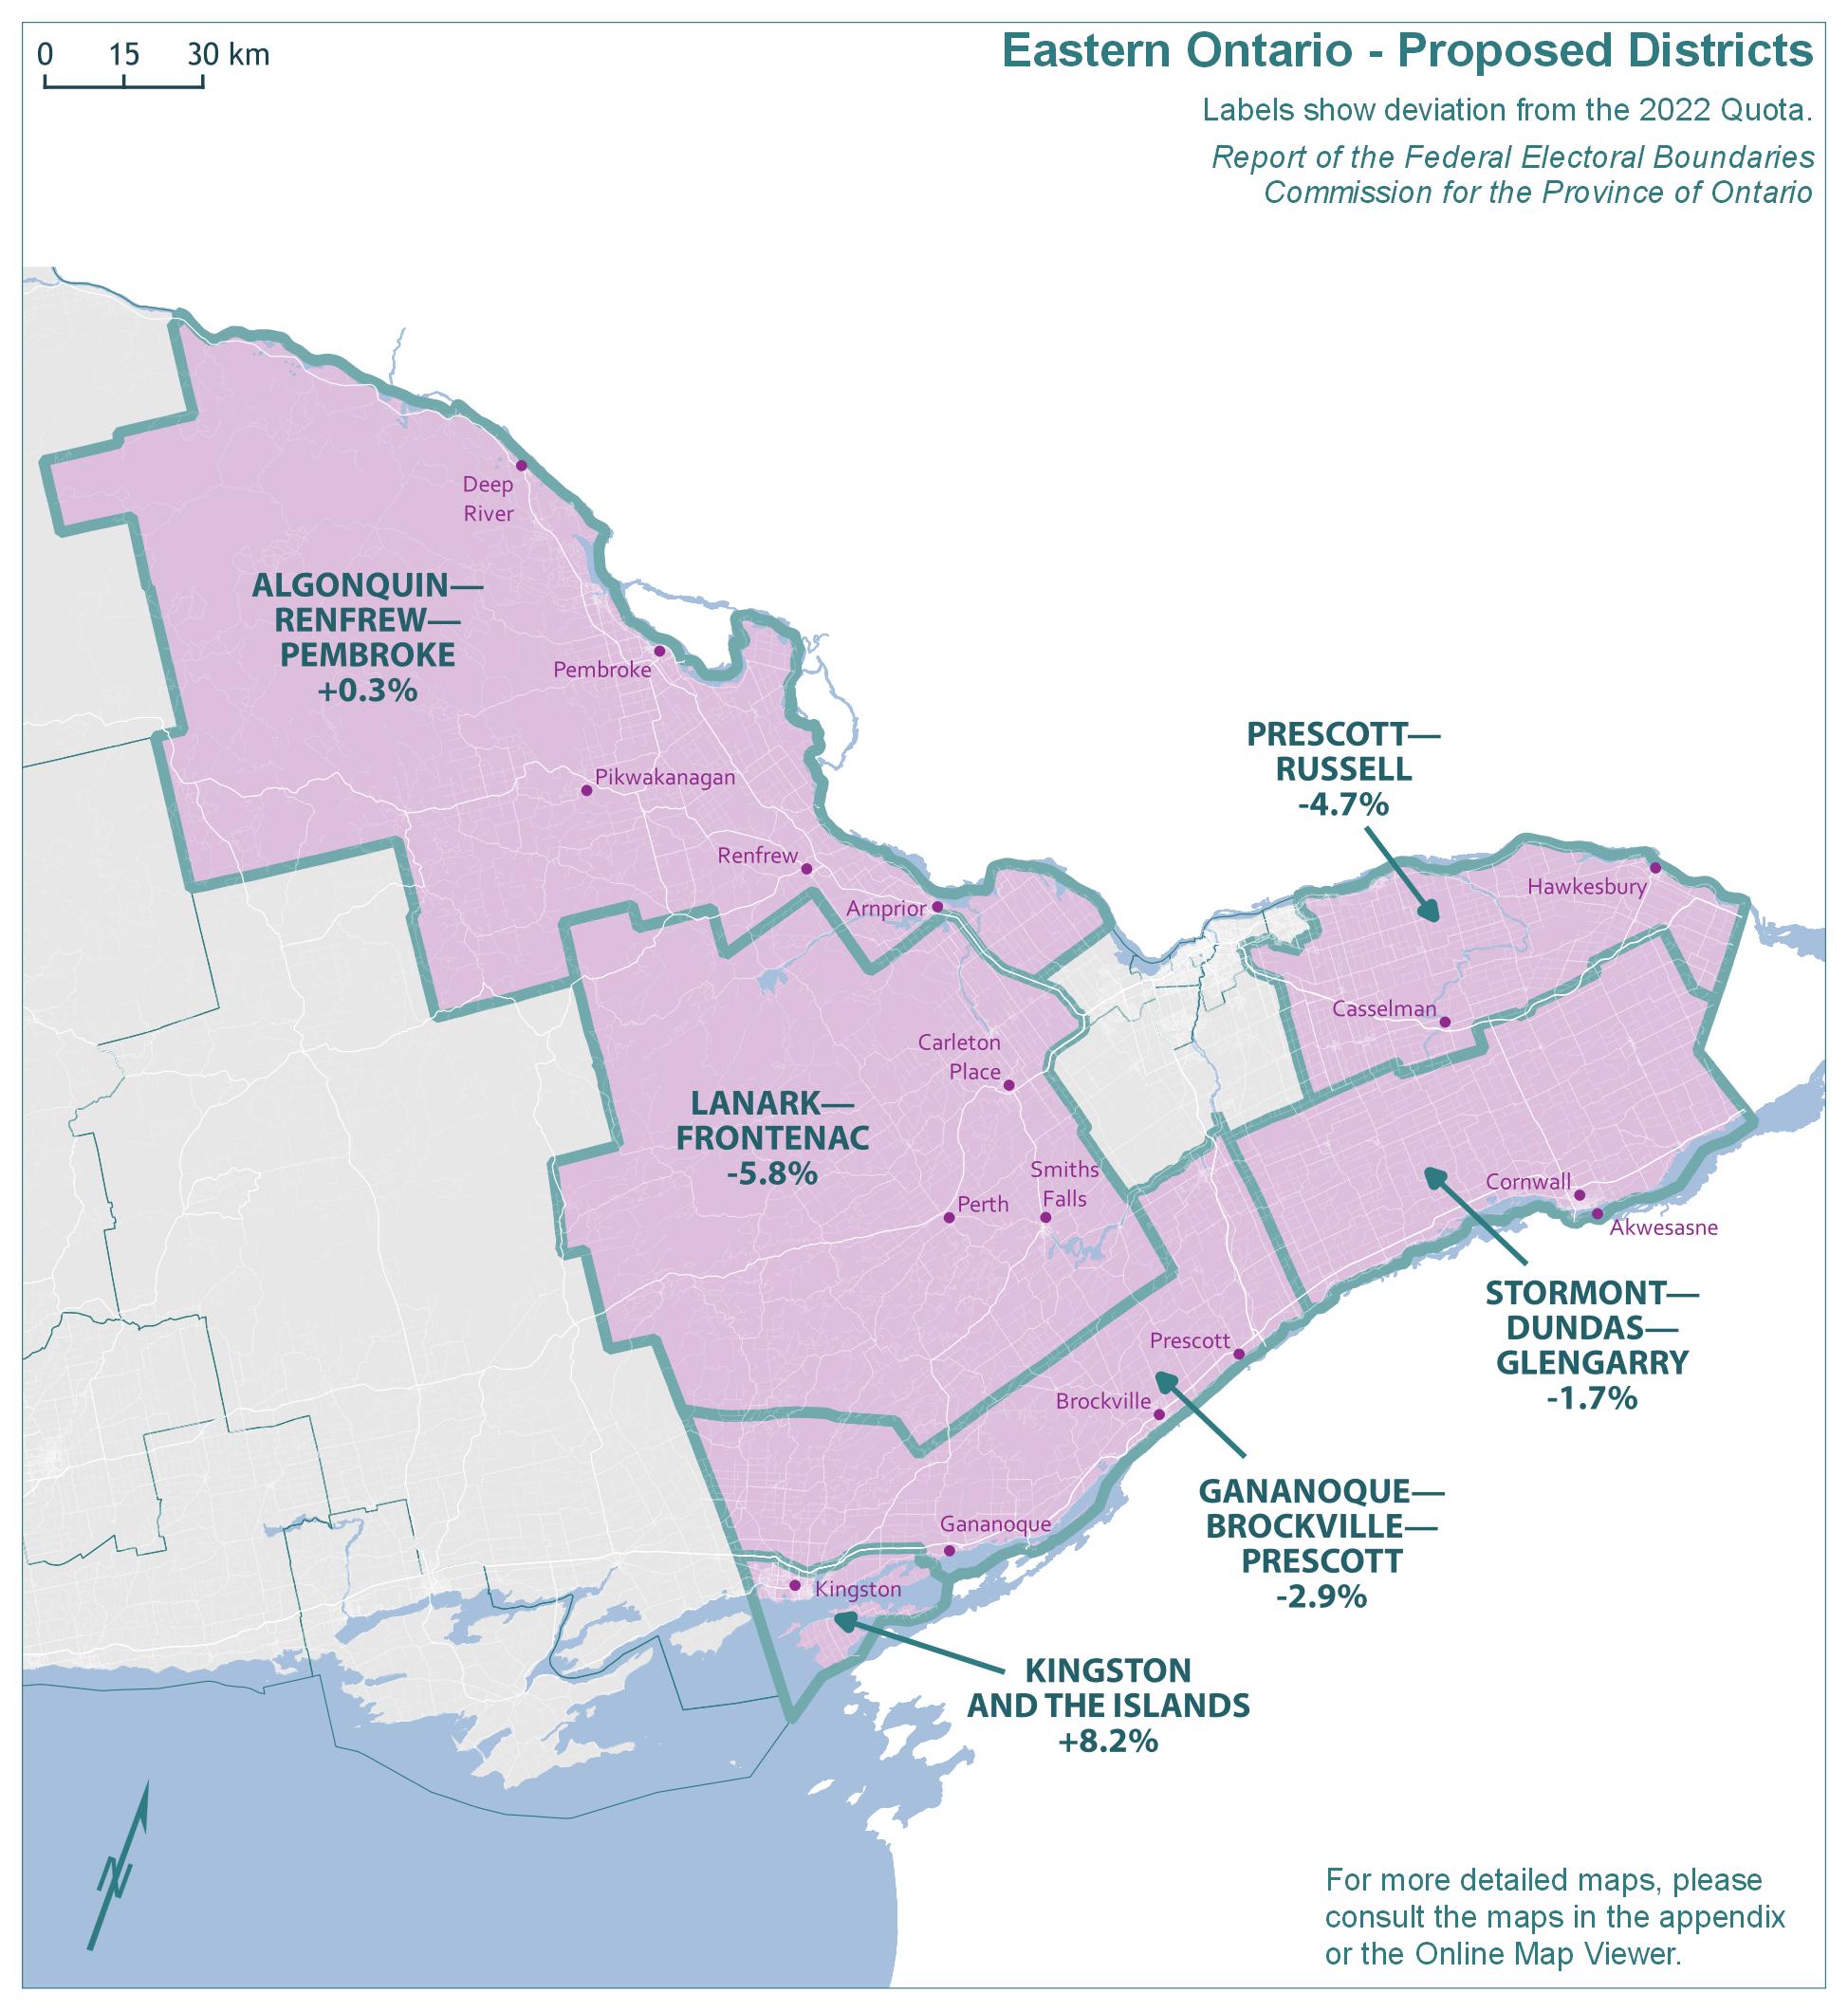
Text version of "Eastern Ontario - Proposed Districts"
Labels show deviation from the 2022 Quota.
Report of the Federal Electoral Boundaries Commission for the Province of Ontario
For more detailed maps, please consult the maps in the appendix or the Online Map Viewer.
| Electoral district | Deviation |
|---|---|
| Algonquin—Renfrew—Pembroke | 0.3% |
| Gananoque—Brockville—Prescott | -2.9% |
| Kingston and the Islands | 8.2% |
| Lanark—Frontenac | -5.8% |
| Prescott—Russell | -4.7% |
| Stormont—Dundas—Glengarry | -1.7% |
Eastern Ontario - Final Districts
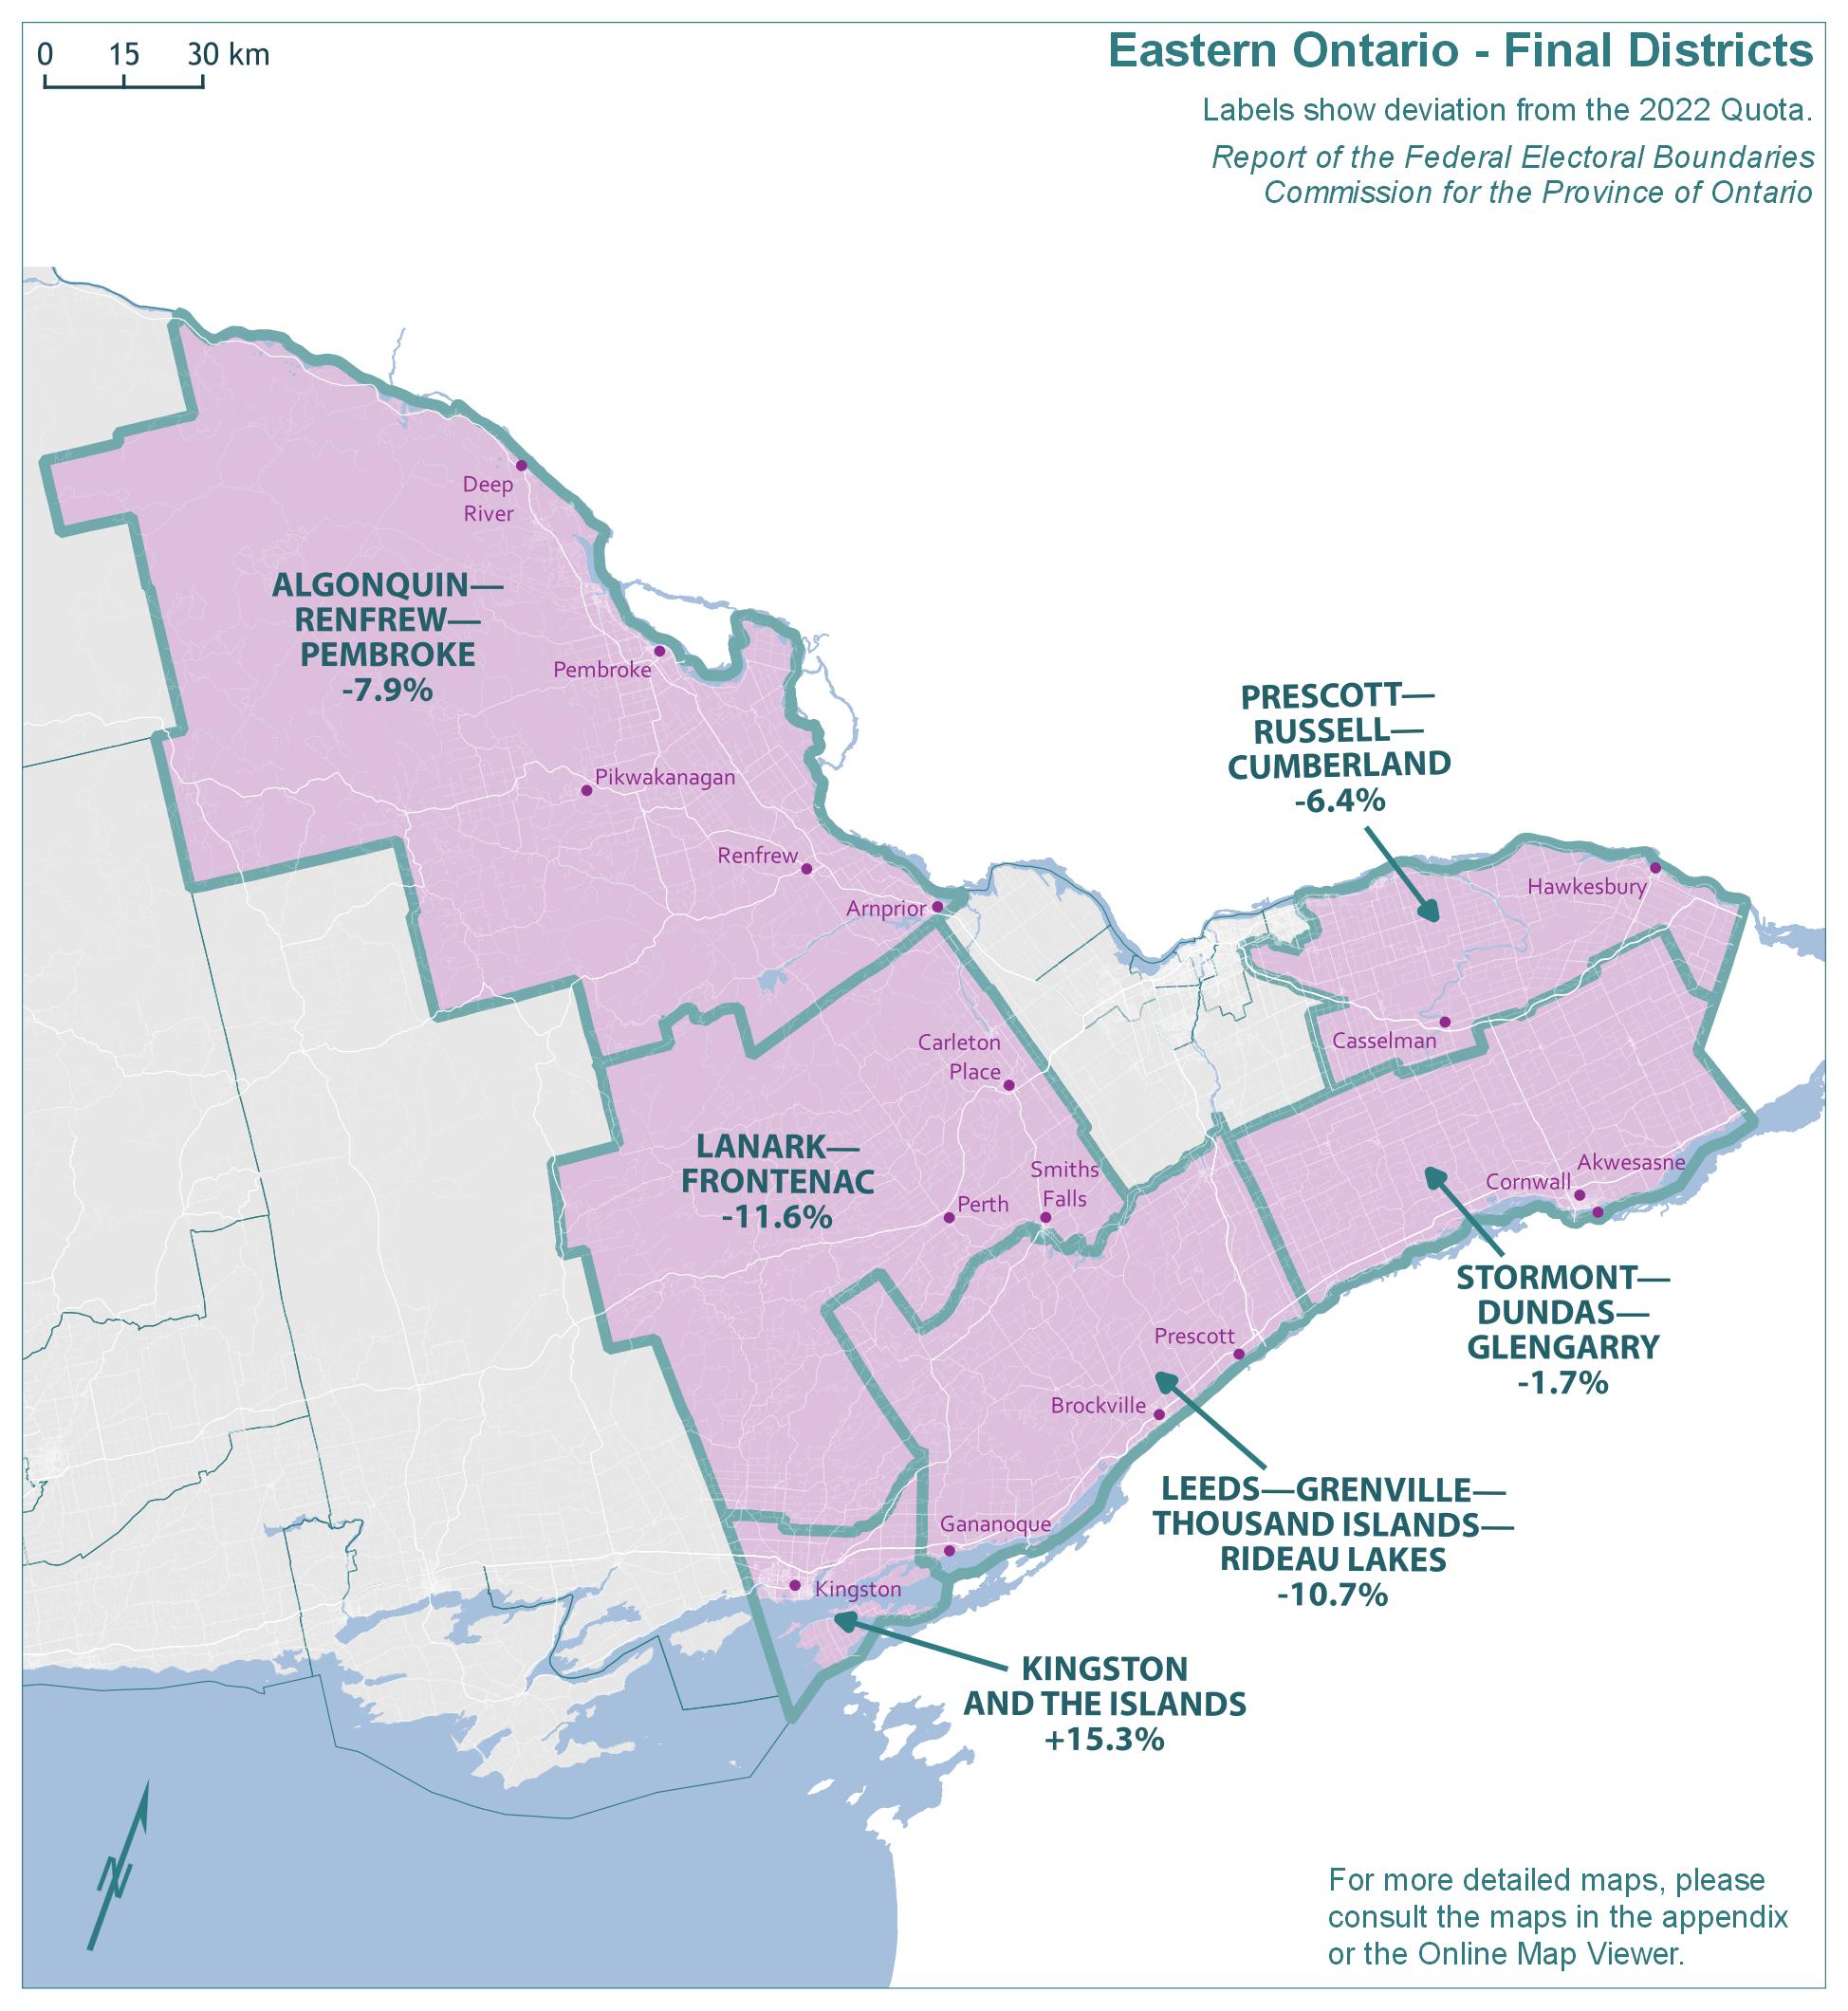
Text version of "Eastern Ontario - Final Districts"
Labels show deviation from the 2022 Quota.
Report of the Federal Electoral Boundaries Commission for the Province of Ontario
For more detailed maps, please consult the maps in the appendix or the Online Map Viewer.
| Electoral district | Deviation |
|---|---|
| Algonquin—Renfrew—Pembroke | -7.9% |
| Kingston and the Islands | 15.3% |
| Lanark—Frontenac | -11.6% |
| Leeds—Grenville—Thousand Islands—Rideau Lakes | -10.7% |
| Prescott—Russell—Cumberland | -6.4% |
The population of Eastern Ontario grew by 7.3%, from 624,416 in 2011 to 669,976 in 2021. The remainder of Ontario grew by 10.8% in the same period.
The existing six electoral districts in Eastern Ontario would have an average 2021 population of 111,663 and an average deviation of -4.2% from the Quota. The absolute range between the least and most populous districts would be 18.9 percentage points.
The populations and deviations from the Quota for the existing electoral districts are shown in Table 3A.
| Electoral Districts | Population – 2011 | Deviation from Quota – 2012 | Population – 2021 | Deviation from Quota – 2022 |
|---|---|---|---|---|
| Glengarry—Prescott—Russell | 106,240 | +0.02% | 116,463 | -0.11% |
| Kingston and the Islands | 116,996 | +10.15% | 126,106 | +8.16% |
| Lanark—Frontenac—Kingston | 98,424 | -7.33% | 111,424 | -4.43% |
| Leeds—Grenville—Thousand Islands and Rideau Lakes | 99,306 | -6.50% | 104,070 | -10.74% |
| Renfrew—Nipissing—Pembroke | 102,537 | -3.46% | 107,420 | -7.87% |
| Stormont—Dundas—South Glengarry | 100,913 | -4.99% | 104,493 | -10.38% |
| Average | 104,069 | -2.02% | 111,663 | -4.23% |
| Range (most populous to least populous) | 18,572 | 17.48 pp | 22,036 | 18.90 pp |
pp = percentage points
In the proposed redistribution plan, changes to boundaries in this geographic piece resulted from the goal of achieving population equality. The Commission endeavoured to maintain districts of manageable size and respect communities of interest. The populations and deviations from the Quota for the proposed districts are shown in Table 3B.
| Electoral Districts | Population – 2021 | Deviation from Quota – 2022 |
|---|---|---|
| Algonquin—Renfrew—Pembroke | 116,900 | +0.27% |
| Gananoque—Brockville—Prescott | 113,266 | -2.85% |
| Kingston and the Islands | 126,106 | +8.16% |
| Lanark—Frontenac | 109,784 | -5.84% |
| Prescott—Russell | 111,163 | -4.65% |
| Stormont—Dundas—Glengarry | 114,637 | -1.68% |
| Average | 115,309 | -1.10% |
| Range (most populous to least populous) | 16,322 | 14.00 pp |
pp = percentage points
Several changes have been made to the proposed boundaries in response to submissions. The Commission received many submissions about the portions of Kingston north of Highway 401, the splitting of several counties, and the transfer of the Township of North Glengarry from Glengarry—Prescott—Russell to Stormont—Dundas—Glengarry.
With respect to Kingston and The Islands, there were many submissions that the parts of Kingston north of Highway 401 should be included in that district to preserve their community of interest and to enhance their representation.
The Commission concluded that this should be implemented. All of the City of Kingston is now in the final district of Kingston And The Islands, along with the Township of Frontenac Islands. This has given the district a deviation from the Quota of +15.3%, the highest in the province.
The Commission determined that this is necessary based on geographical circumstances. There are limitations on where this district can be divided considering that the southern part of the district consists of islands. Further, there was an overwhelming number of independent submissions to maintain the municipal boundary as the district boundary, where the anticipated growth is relatively modest. The Commission observes that it may not be reasonably possible to maintain these boundaries in the future.
The Commission also received submissions from residents in the Township of South Frontenac. Some residents requested that they be placed in Kingston And The Islands. However, the Commission concluded that the resulting deviation from the Quota would be unreasonably large. Other submissions, including one from the Township itself, suggested that the Township of South Frontenac should be maintained with the rest of Frontenac County in Lanark—Frontenac. The Commission found these arguments persuasive as such a change preserves effective representation. Lanark—Frontenac has been restored to its existing boundaries, with the exception of the areas that were within the City of Kingston.
The district of Leeds—Grenville—Thousand Islands and Rideau Lakes has been returned to its existing boundary. The name has been changed to Leeds—Grenville—Thousand Islands—Rideau Lakes, as recommended by the Geographic Names Board of Canada, allowing for the same name to be used in English and French.
The proposed redistribution plan had split the ten townships which make up the United Counties of Leeds and Grenville across the proposed districts of Lanark—Frontenac and Gananoque—Brockville—Prescott.
The Commission received requests to keep these ten townships together, where numerous economic, social and historical ties exist. The Commission concluded that this request was reasonable and would preserve the existing effective representation of the lower-tier municipalities. Implementing this request also permitted the Township of Elizabethtown-Kitley to remain whole, as requested, for the same purpose and permitted the municipalities of Rideau Lakes, Westport and Merrickville-Wolford to remain within this district. Similarly, the municipalities of Brockville, Gananoque and Prescott have also been returned to this district.
The Commission implemented the widely supported request to maintain Rideau Lakes in the district name.
Algonquin—Renfrew—Pembroke (formerly Renfrew—Nipissing—Pembroke) has been returned to its former boundaries. In the proposal, the Commission had removed the Township of Greater Madawaska, separating it from the rest of Renfrew County. We heard compelling submissions that this division compromised effective representation and would disrupt coherent communication with elected representatives and service delivery across Renfrew County. Greater Madawaska has thus been returned to Algonquin—Renfrew—Pembroke and the southeastern boundary for this district has been moved back to the existing boundary on the Arnprior-Ottawa municipal border.
The name of this district has been changed from Renfrew—Nipissing—Pembroke to Algonquin—Renfrew—Pembroke, representing the fact that only a very small portion of Nipissing is in this district. The new name also recognizes the importance of the Algonquin people's history and presence in this region.
In the most eastern portion of Ontario, the Commission made small but notable changes to boundaries. In doing so, we took careful consideration of the impact of boundary changes for the significant Franco-Ontarian population of this part of the province.
The Commission received submissions to add Cumberland to the name of Prescott—Russell, recognizing that the district extends into the City of Ottawa and includes the former historic township of Cumberland. The Commission agreed with these submissions and has renamed the district Prescott—Russell—Cumberland. There has been a minor change to the western boundary of the proposed district. This simplifies the border by aligning it to Highway 417 and the Ottawa-Russell municipal limits.
In the proposed redistribution plan, the Township of North Glengarry was moved from the existing district of Glengarry—Prescott—Russell to the proposed district of Stormont—Dundas—Glengarry, lying immediately south. This change is maintained in the final districts of Prescott—Russell—Cumberland and Stormont—Dundas—Glengarry.
There was considerable support from municipal leaders for this change. The Township of North Glengarry engaged its community regarding the proposed redistribution. The Township posted information on social media and in local newspapers and conducted a survey in French and English. The reported survey results showed overwhelming support for this change, which resulted in the Township being aligned with its upper-tier municipality. In addition, this realignment was also strongly supported by a submission from the Glengarry Federation of Agriculture.
However, there were a few expressions of concern by the Francophone community in the Township of North Glengarry (which itself is 35% First Official Language French, according to the 2021 Census). One submission noted that, under the proposed redistribution plan, the Township would be moving to a more Anglophone district. (In fact, this Township would shift from a district where presently 56% of the population identifies as First Official Language French to a district that would be 19% First Official Language French, as per Tables: Existing and Final Districts – Mother Tongue and First Official Language Estimates on pages 27 and 28). It was asserted that, for Franco-Ontarians in North Glengarry, there was little alignment of interests with the upper-tier municipality (the United Counties of Stormont, Dundas & Glengarry) and that the continued association with the majority Francophone district to the north would better ensure that Francophone issues remain at the forefront of priorities within the riding and the regional municipality.
As evidence for this assertion, the Commission was informed that the United Counties of Stormont, Dundas & Glengarry did not translate their website into French, and that an issue around resources for French and English schools had brought North Glengarry into conflict with the other lower-tier municipalities.
In reviewing this issue, the Commission weighed whether it would be more advantageous to Franco-Ontarian interests to place this community with the majority Francophone population in Prescott—Russell—Cumberland than with the minority Francophone population in Stormont—Dundas—Glengarry, and whether any such benefit outweighed the interest in restoring the territorial integrity of the United Counties.
Among the municipalities in Stormont—Dundas—Glengarry, North Glengarry has the largest Francophone population (35%); however, there are several others (South Glengarry at 26%, North Stormont at 26%, Cornwall at 19%) that ensure substantial weight of Franco-Ontarian interests in the riding. The Commission noted that there is a strong record of the existing minority Francophone district (Stormont—Dundas—South Glengarry) having elected Francophone MPs.
The Commission also noted that the issue of French language services within their community was a key expression of concern by those opposing the North Glengarry change. As we have already indicated, Franco-Ontarians continue to exert their rights to such services notwithstanding the change in electoral boundaries.
The Commission concluded, given all of these circumstances, that it was reasonable to implement the proposed change in relation to the Township of North Glengarry.
The names, populations and deviations from the Quota for Eastern Ontario's final districts are shown in Table 3C.
| Electoral Districts | Population – 2021 | Deviation from Quota – 2022 |
|---|---|---|
| Algonquin—Renfrew—Pembroke | 107,420 | -7.87% |
| Kingston and the Islands | 134,415 | +15.29% |
| Lanark—Frontenac | 103,120 | -11.55% |
| Leeds—Grenville—Thousand Islands—Rideau Lakes | 104,075 | -10.73% |
| Prescott—Russell—Cumberland | 109,125 | -6.40% |
| Stormont—Dundas—Glengarry | 114,637 | -1.68% |
| Average | 112,132 | -3.82% |
| Range (most populous to least populous) | 31,295 | 26.84 pp |
pp = percentage points
Ottawa
Ottawa - Existing Districts
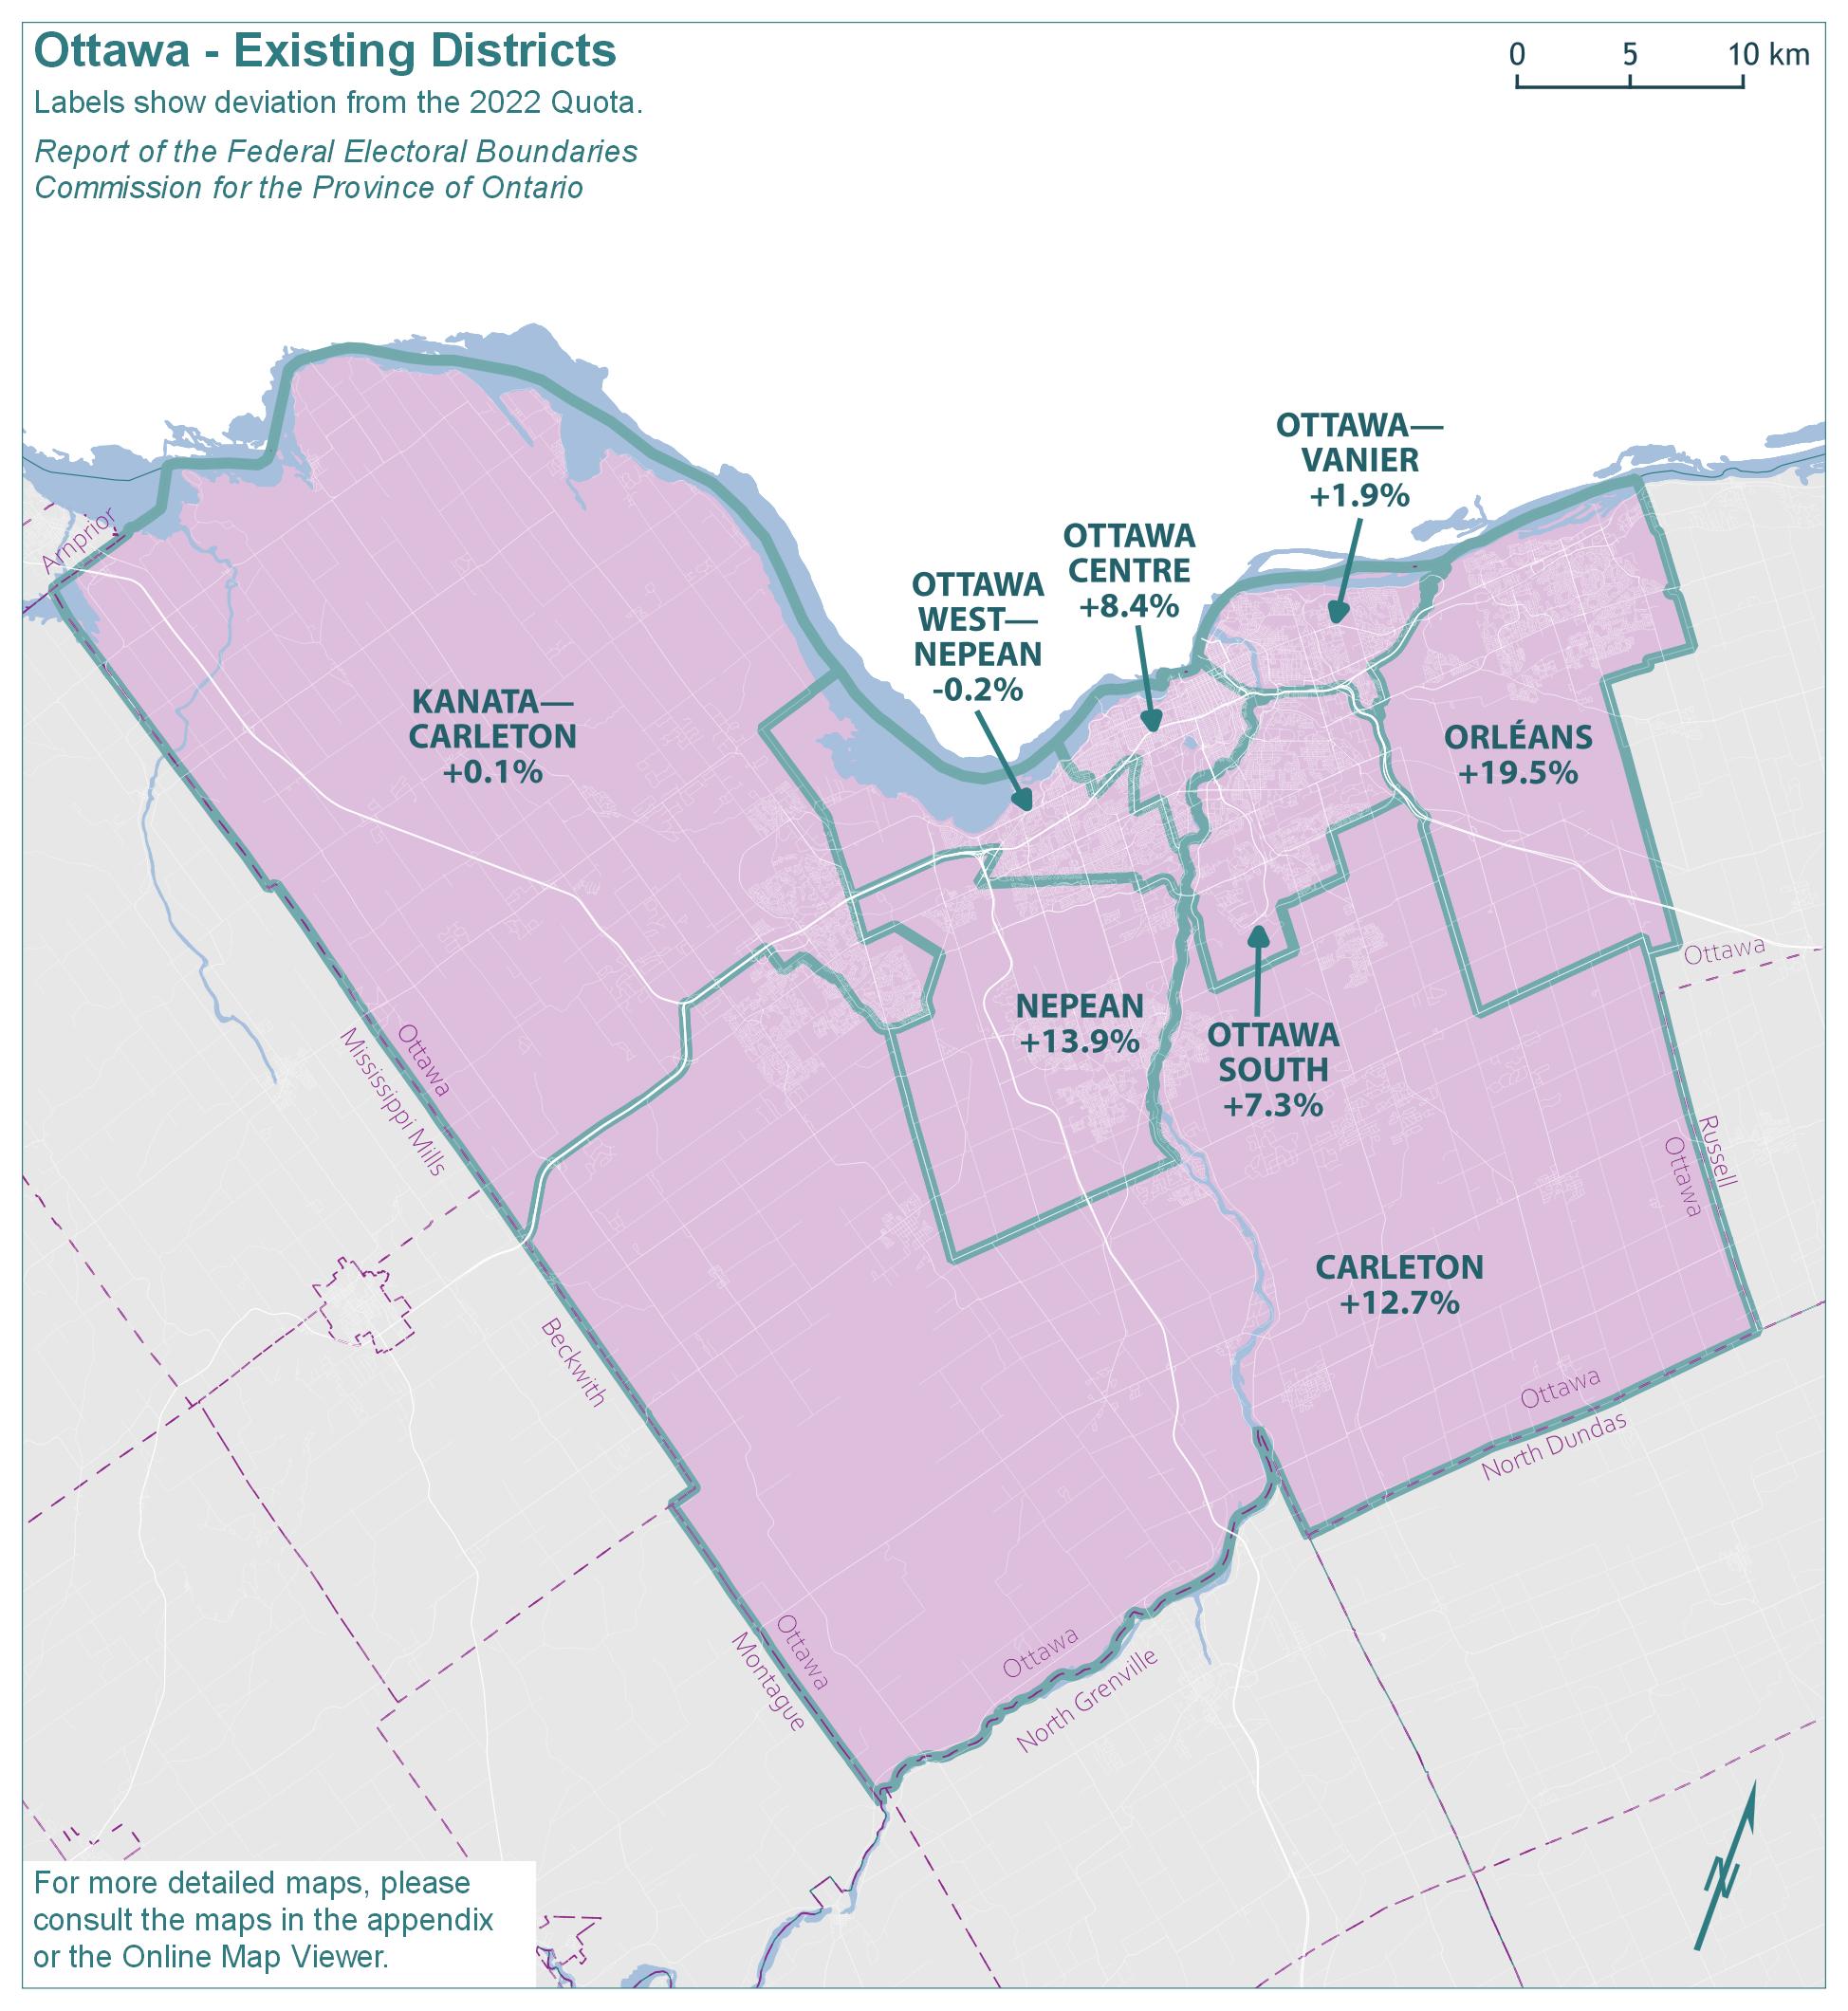
Text version of "Ottawa - Existing Districts"
Labels show deviation from the 2022 Quota.
Report of the Federal Electoral Boundaries Commission for the Province of Ontario
For more detailed maps, please consult the maps in the appendix or the Online Map Viewer.
| Electoral district | Deviation |
|---|---|
| Carleton | 12.7% |
| Kanata—Carleton | 0.1% |
| Nepean | 13.9% |
| Orleans | 19.5% |
| Ottawa Centre | 8.4% |
| Ottawa South | 7.3% |
| Ottawa West—Nepean | -0.2% |
| Ottawa—Vanier | 1.9% |
Ottawa - Proposed Districts
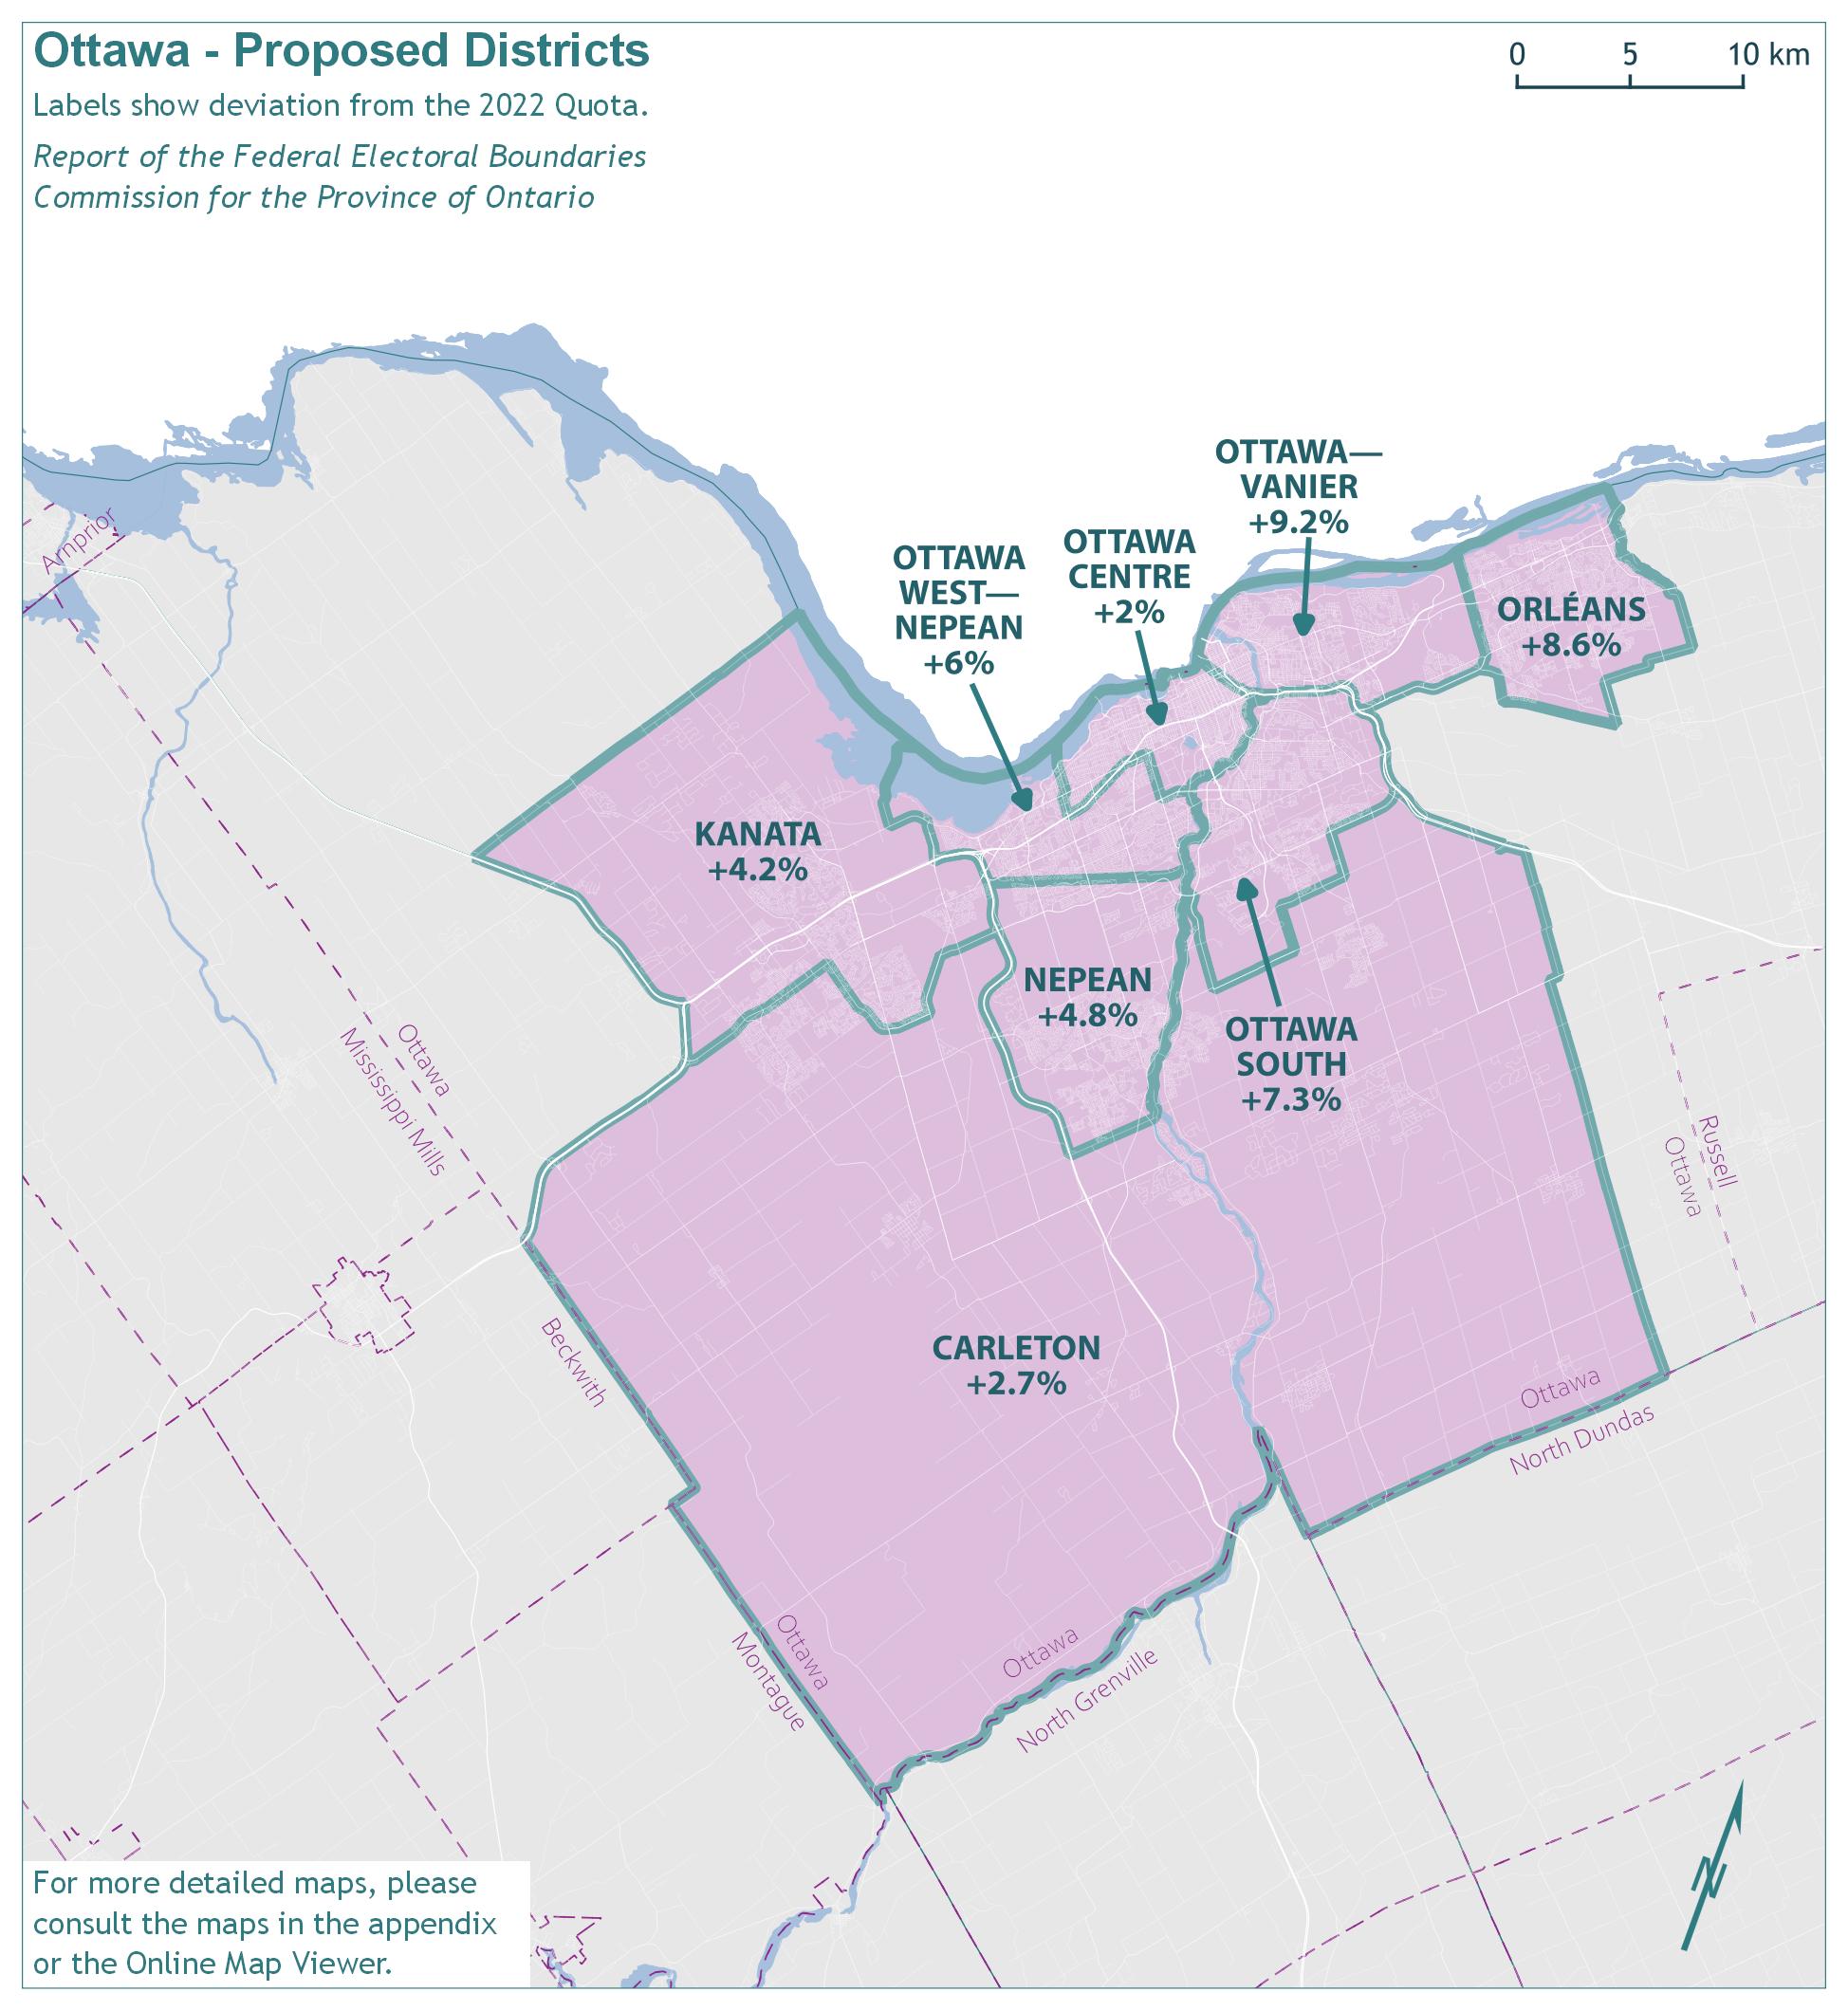
Text version of "Ottawa - Proposed Districts"
Labels show deviation from the 2022 Quota.
Report of the Federal Electoral Boundaries Commission for the Province of Ontario
For more detailed maps, please consult the maps in the appendix or the Online Map Viewer.
| Electoral district | Deviation |
|---|---|
| Carleton | 2.7% |
| Kanata | 4.2% |
| Nepean | 4.8% |
| Orléans | 8.6% |
| Ottawa Centre | 2.0% |
| Ottawa South | 7.3% |
| Ottawa—Vanier | 9.2% |
| Ottawa West—Nepean | 6.0% |
Ottawa - Final Districts
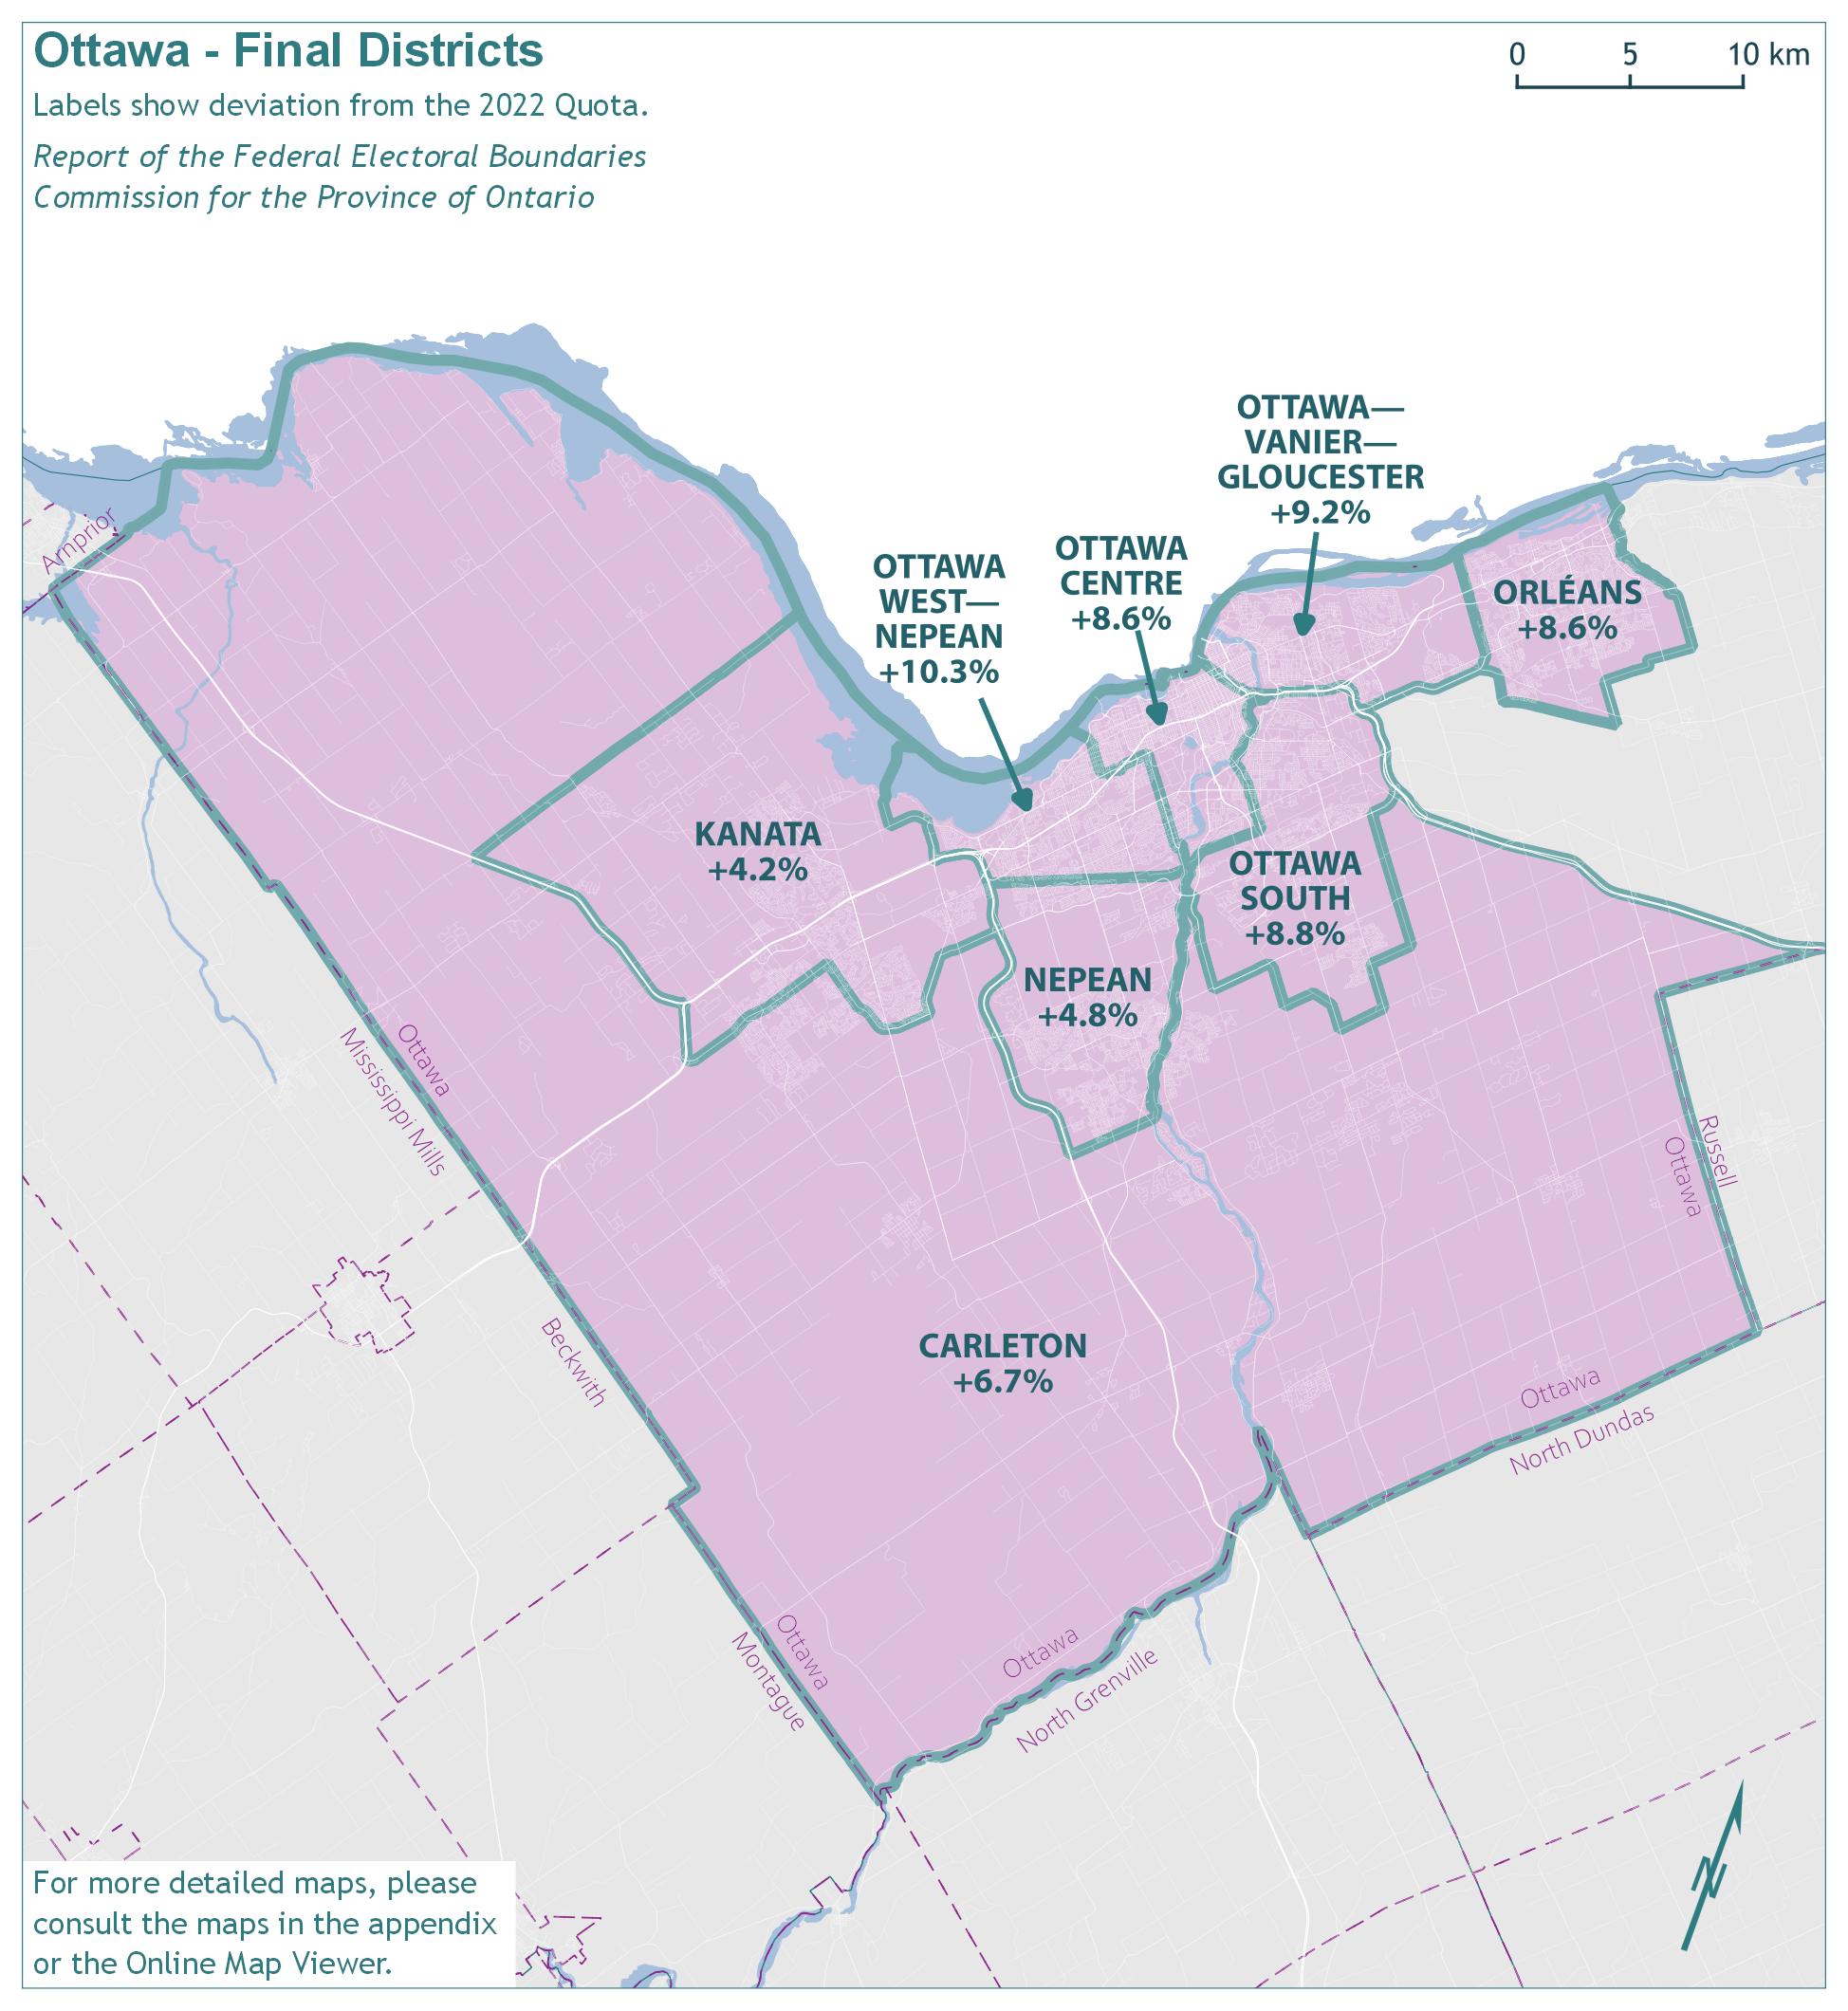
Text version of "Ottawa - Final Districts"
Labels show deviation from the 2022 Quota.
Report of the Federal Electoral Boundaries Commission for the Province of Ontario
For more detailed maps, please consult the maps in the appendix or the Online Map Viewer.
| Electoral district | Deviation |
|---|---|
| Carleton | 6.7% |
| Kanata | 4.2% |
| Nepean | 4.8% |
| Orléans | 8.6% |
| Ottawa Centre | 8.6% |
| Ottawa South | 8.8% |
| Ottawa West—Nepean | 10.3% |
The population of the Ottawa geographic piece grew by 15.4%, from 872,783 in 2011 to 1,006,769 in 2021. The remainder of Ontario grew by 10.3% in the same period.
The existing eight electoral districts in the Ottawa geographic piece would have an average 2021 population of 125,846 and an average deviation of 7.9% from the Quota. The absolute range between the least and most populous districts would be 19.7 percentage points. The populations and deviations from the Quota for the existing electoral districts are shown in Table 4A.
| Electoral Districts | Population – 2011 | Deviation from Quota – 2012 | Population – 2021 | Deviation from Quota – 2022 |
|---|---|---|---|---|
| Carleton | 89,522 | -15.72% | 131,375 | +12.68% |
| Kanata—Carleton | 100,846 | -5.05% | 116,651 | +0.05% |
| Nepean | 104,775 | -1.35% | 132,769 | +13.88% |
| Orléans | 119,247 | +12.27% | 139,309 | +19.49% |
| Ottawa Centre | 113,619 | +6.97% | 126,360 | +8.38% |
| Ottawa South | 121,894 | +14.76% | 125,090 | +7.29% |
| Ottawa West—Nepean | 111,881 | +5.34% | 116,409 | -0.16% |
| Ottawa—Vanier | 110,999 | +4.51% | 118,806 | +1.90% |
| Average | 109,098 | +2.72% | 125,846 | +7.94% |
| Range (most populous to least populous) | 32,372 | 30.48 pp | 22,900 | 19.65 pp |
pp = percentage points
When the proposed redistribution plan was prepared, significant redrawing was required, given the large deviations from the Quota in the suburban area comprised of the existing districts of Carleton, Nepean, and Orléans. The Commission noted that these three districts are underrepresented with populations that are, respectively, 12.7%, 13.9% and 19.5% above the Quota. The proposed boundary changes brought these districts closer to the Quota. The populations and deviations from the Quota are shown in Table 4B.
| Electoral Districts | Population – 2021 | Deviation from Quota – 2022 |
|---|---|---|
| Carleton | 119,737 | +2.70% |
| Kanata | 121,458 | +4.18% |
| Nepean | 122,229 | +4.84% |
| Orléans | 126,662 | +8.64% |
| Ottawa Centre | 118,950 | +2.02% |
| Ottawa South | 125,075 | +7.28% |
| Ottawa—Vanier | 127,255 | +9.15% |
| Ottawa West—Nepean | 123,533 | +5.96% |
| Average | 123,112 | +5.60% |
| Range (most populous to least populous) | 8,305 | 7.13 pp |
pp = percentage points
The most notable change in the proposed redistribution plan concerned the district of Orléans, where an adjustment to the southern boundary pushed it up towards the Ottawa River, bringing its population much closer to parity with surrounding districts.
Population growth in the existing districts of Nepean and Carleton necessitated further boundary changes that in turn impacted the existing district of Kanata—Carleton. The Commission proposed shifting the boundaries of the proposed district of Kanata to the east to address these disparities.
The Commission endeavoured to respect the interests of the Francophone community by ensuring that their representation in the proposed districts of Orléans (31% Francophone), Ottawa—Vanier (27% Francophone) and Ottawa South (13% Francophone) was maintained.
Many submissions reflected support for the proposed boundaries of Kanata while many also asked that their communities be retained in Kanata.
Many submissions in this geographic piece focused on the distinctions between effective representation of urban and rural interests.
In particular, submissions were made regarding the fact that in the proposed redistribution plan West Carleton was divided into three ridings (two of which were large rural districts that extended well over 100 km outside of Ottawa's municipal limits). The Commission noted that West Carleton no longer officially exists as a township, having been amalgamated with Ottawa in 2001.
Many of these submissions requested that West Carleton be added back to the existing district of Kanata—Carleton. However, the Commission also received many submissions supporting the new boundaries for the proposed district of Kanata.
As a compromise solution, the Commission has added the West Carleton communities to the final district of Carleton, allowing West Carleton to at least be maintained in a district entirely based in Ottawa. This aligns much of Ottawa's rural neighbourhoods into a single district.
Two other changes have been made to Carleton. First, the proposed boundary on 9th Line Road has been shifted to the Boundary Road and Highway 417, as was suggested by residents in the area. This simplifies the boundary and better aligns the district with the municipal boundaries.
Secondly, the suburban neighbourhood of Findlay Creek has been moved to Ottawa South. The Commission received submissions requesting that Findlay Creek be part of the suburban Ottawa South district as opposed to the more rural district of Carleton. The Commission recognized the value of creating a district within the rural boundaries of the City of Ottawa and maintaining the suburban districts created by our proposal.
The transfer of Findlay Creek into Ottawa South precipitated some domino effects on Ottawa's proposed urban districts. The neighbourhoods of Carleton Heights and Riverside Park were moved into Ottawa Centre. The Commission felt it was appropriate to move these communities into Ottawa Centre, based on submissions explaining the importance of keeping the Rideau River communities together. Heron Park also had to be placed into Ottawa Centre, in order to bring Ottawa South's deviation from the Quota to acceptable limits.
These shifts also allowed the Commission to move Glabar Park and Carlingwood into Ottawa West—Nepean, as was suggested in the public consultations. Carlington will also remain in Ottawa West—Nepean, as it was in the proposal. Several submissions supported this, especially noticing the improvement of placing the neighbourhood entirely within a single district.
The Commission also received several requests to allow the community of Blackburn Hamlet to remain in Orléans. The Commission concluded that it was not necessary or desirable to allow the deviation from Quota for this district to move as high as 18%. Orléans remains unchanged from the proposed redistribution plan.
However, the Commission agreed with the alternative suggestion that the district in which Blackburn Hamlet has been located be renamed Ottawa—Vanier—Gloucester.
The Commission also received multiple submissions about the community of Bells Corners. The submissions were split as to whether Bells Corners was better in Kanata or Nepean. As such, the Commission opted to leave it in Kanata as it had decided in the proposal. Given the generally supportive comments for the proposed boundaries of these two districts, the Kanata and Nepean final boundaries will remain unchanged from the proposal.
The names, populations and deviations from the Quota for Ottawa's final districts are shown in Table 4C.
| Electoral Districts | Population – 2021 | Deviation from Quota – 2022 |
|---|---|---|
| Carleton | 124,416 | +6.71% |
| Kanata | 121,458 | +4.18% |
| Nepean | 122,229 | +4.84% |
| Orléans | 126,662 | +8.64% |
| Ottawa Centre | 126,560 | +8.55% |
| Ottawa South | 126,791 | +8.75% |
| Ottawa—Vanier—Gloucester | 127,255 | +9.15% |
| Ottawa West—Nepean | 128,592 | +10.29% |
| Average | 125,495 | +7.64% |
| Range (most populous to least populous) | 7,134 | 6.11 pp |
pp = percentage points
Central East Ontario
Central East Ontario - Existing Districts

Text version of "Central East Ontario - Existing Districts"
Labels show deviation from the 2022 Quota.
Report of the Federal Electoral Boundaries Commission for the Province of Ontario
For more detailed maps, please consult the maps in the appendix or the Online Map Viewer.
| Electoral district | Deviation |
|---|---|
| Bay of Quinte | -0.5% |
| Haliburton—Kawartha Lakes—Brock | 5.0% |
| Hastings—Lennox and Addington | -13.7% |
| Northumberland—Peterborough South | 1.9% |
| Peterborough—Kawartha | 7.6% |
Central East Ontario - Proposed Districts
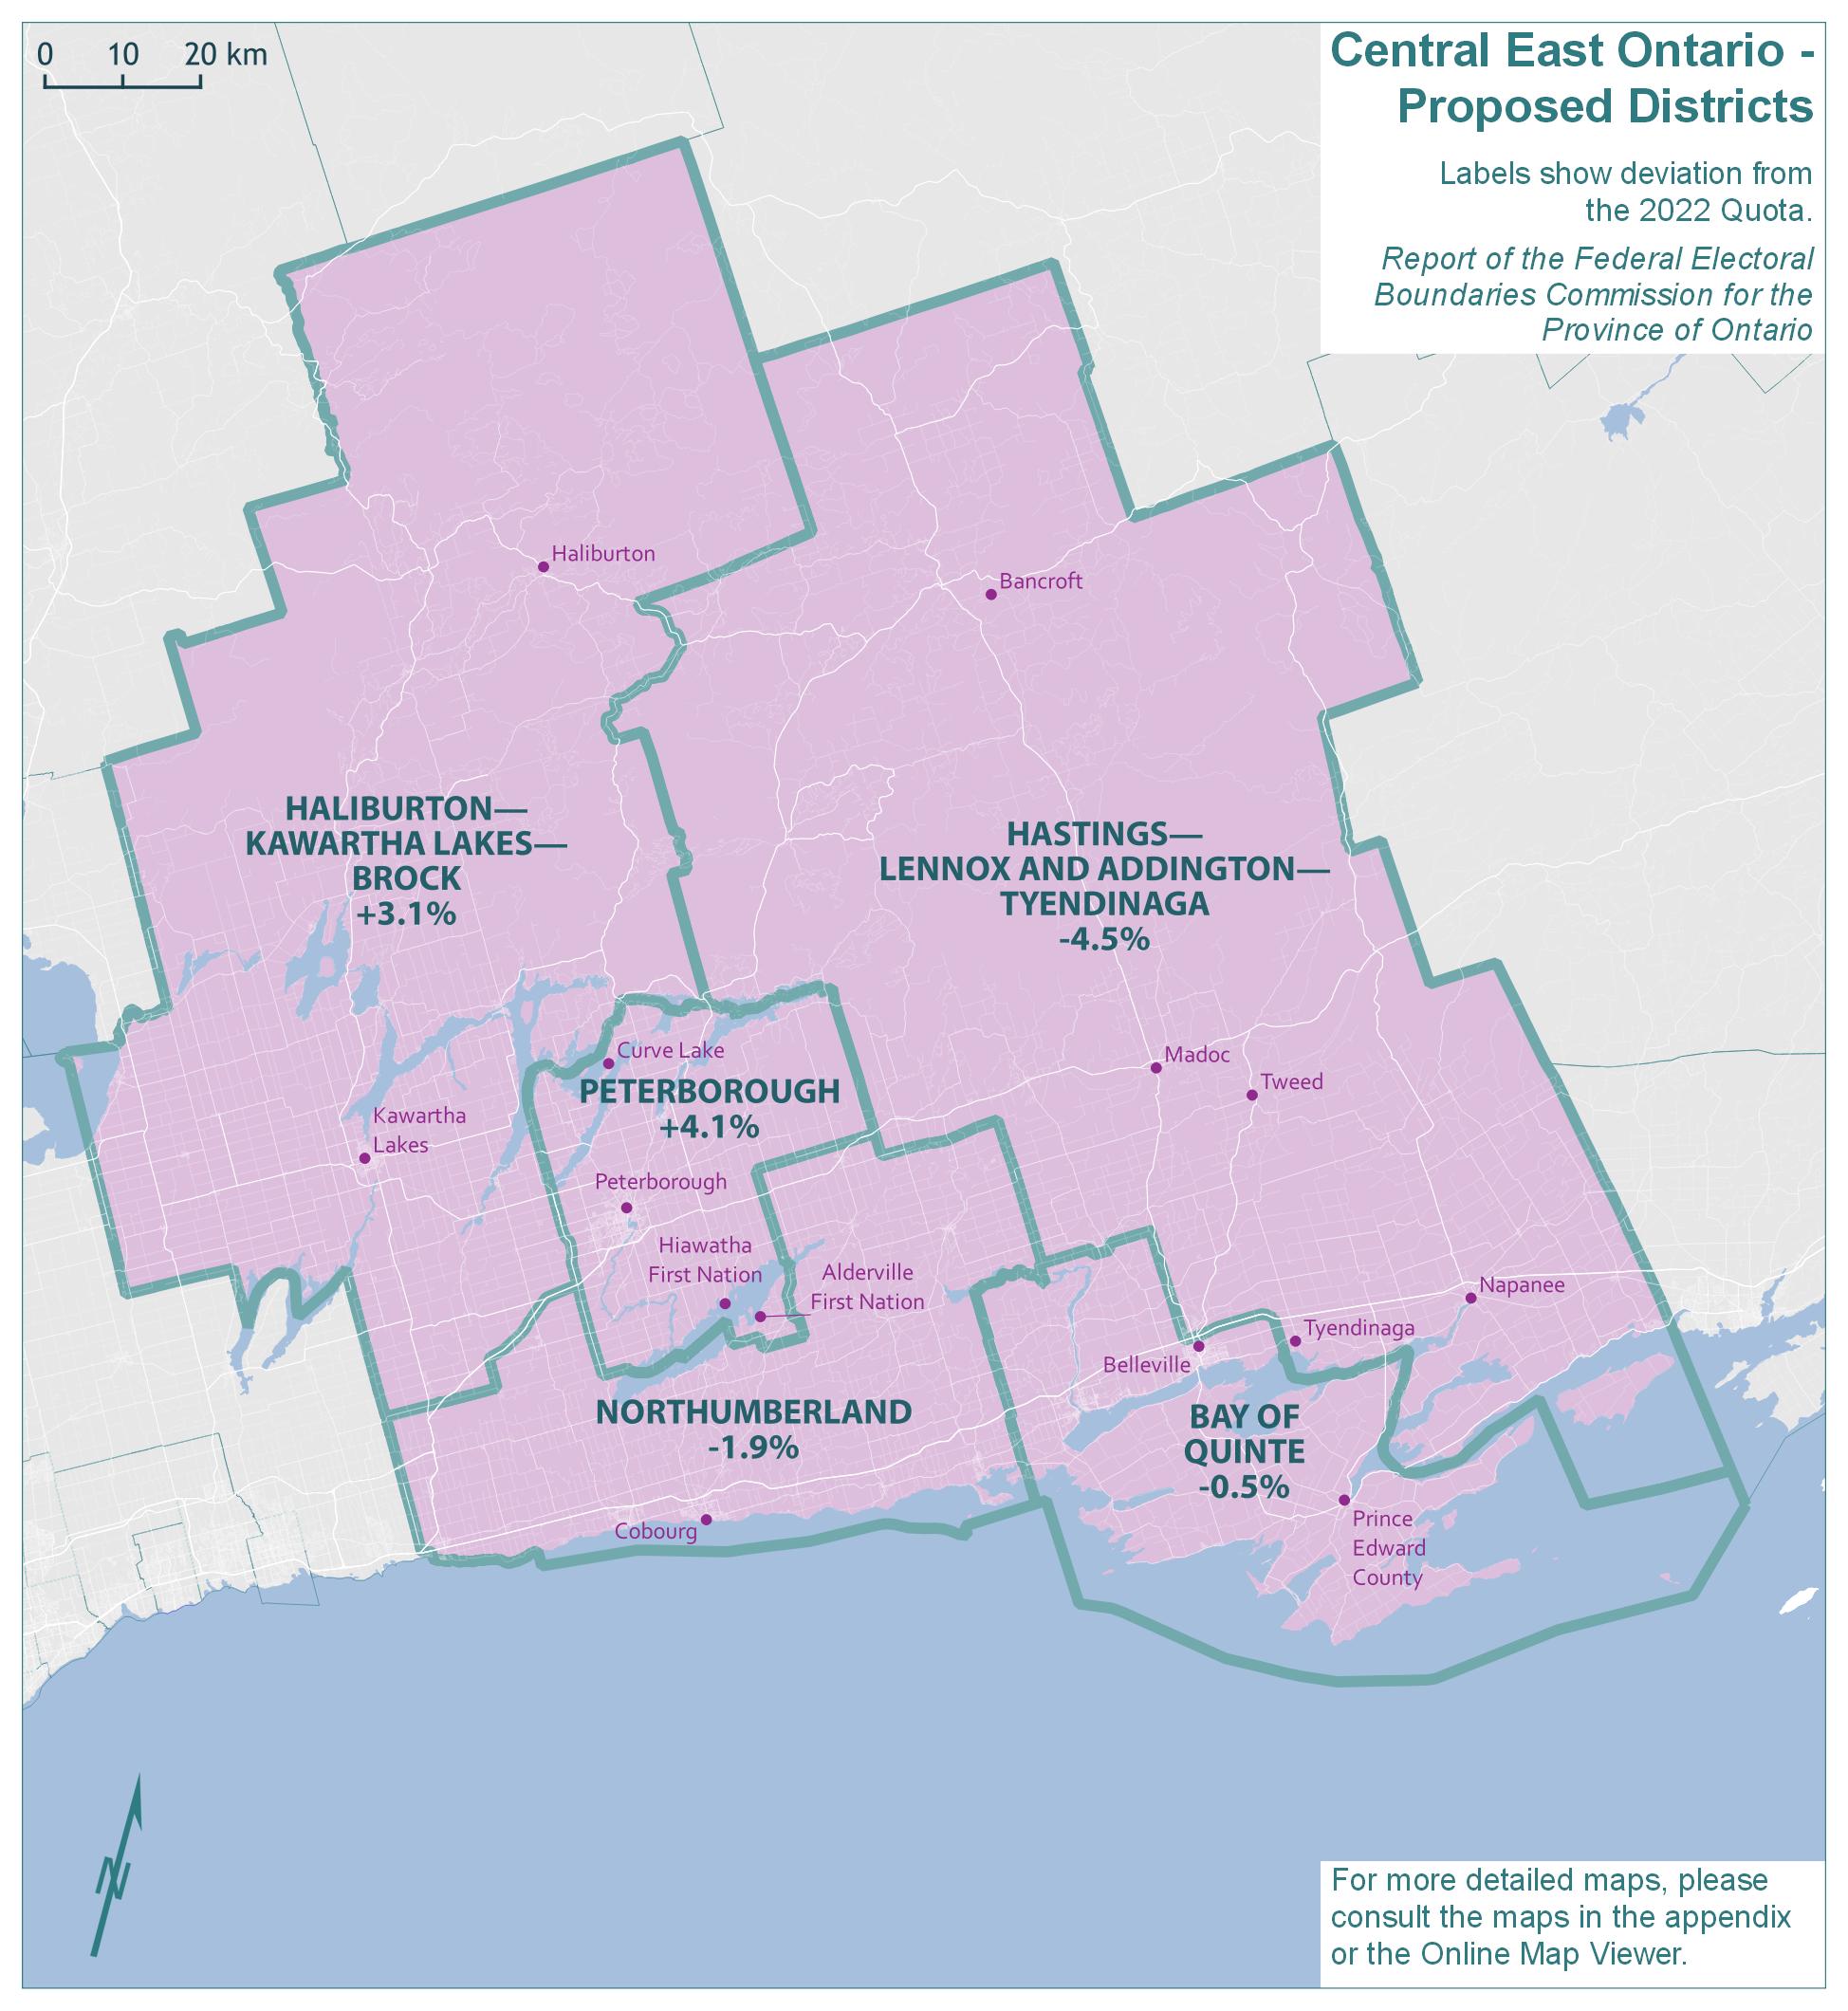
Text version of "Central East Ontario - Proposed Districts"
Labels show deviation from the 2022 Quota.
Report of the Federal Electoral Boundaries Commission for the Province of Ontario
For more detailed maps, please consult the maps in the appendix or the Online Map Viewer.
| Electoral district | Deviation |
|---|---|
| Bay of Quinte | -0.5% |
| Haliburton—Kawartha Lakes—Brock | 3.1% |
| Hastings—Lennox and Addington—Tyendinaga | -4.5% |
| Northumberland | -1.9% |
| Peterborough | 4.1% |
Central East Ontario - Final Districts
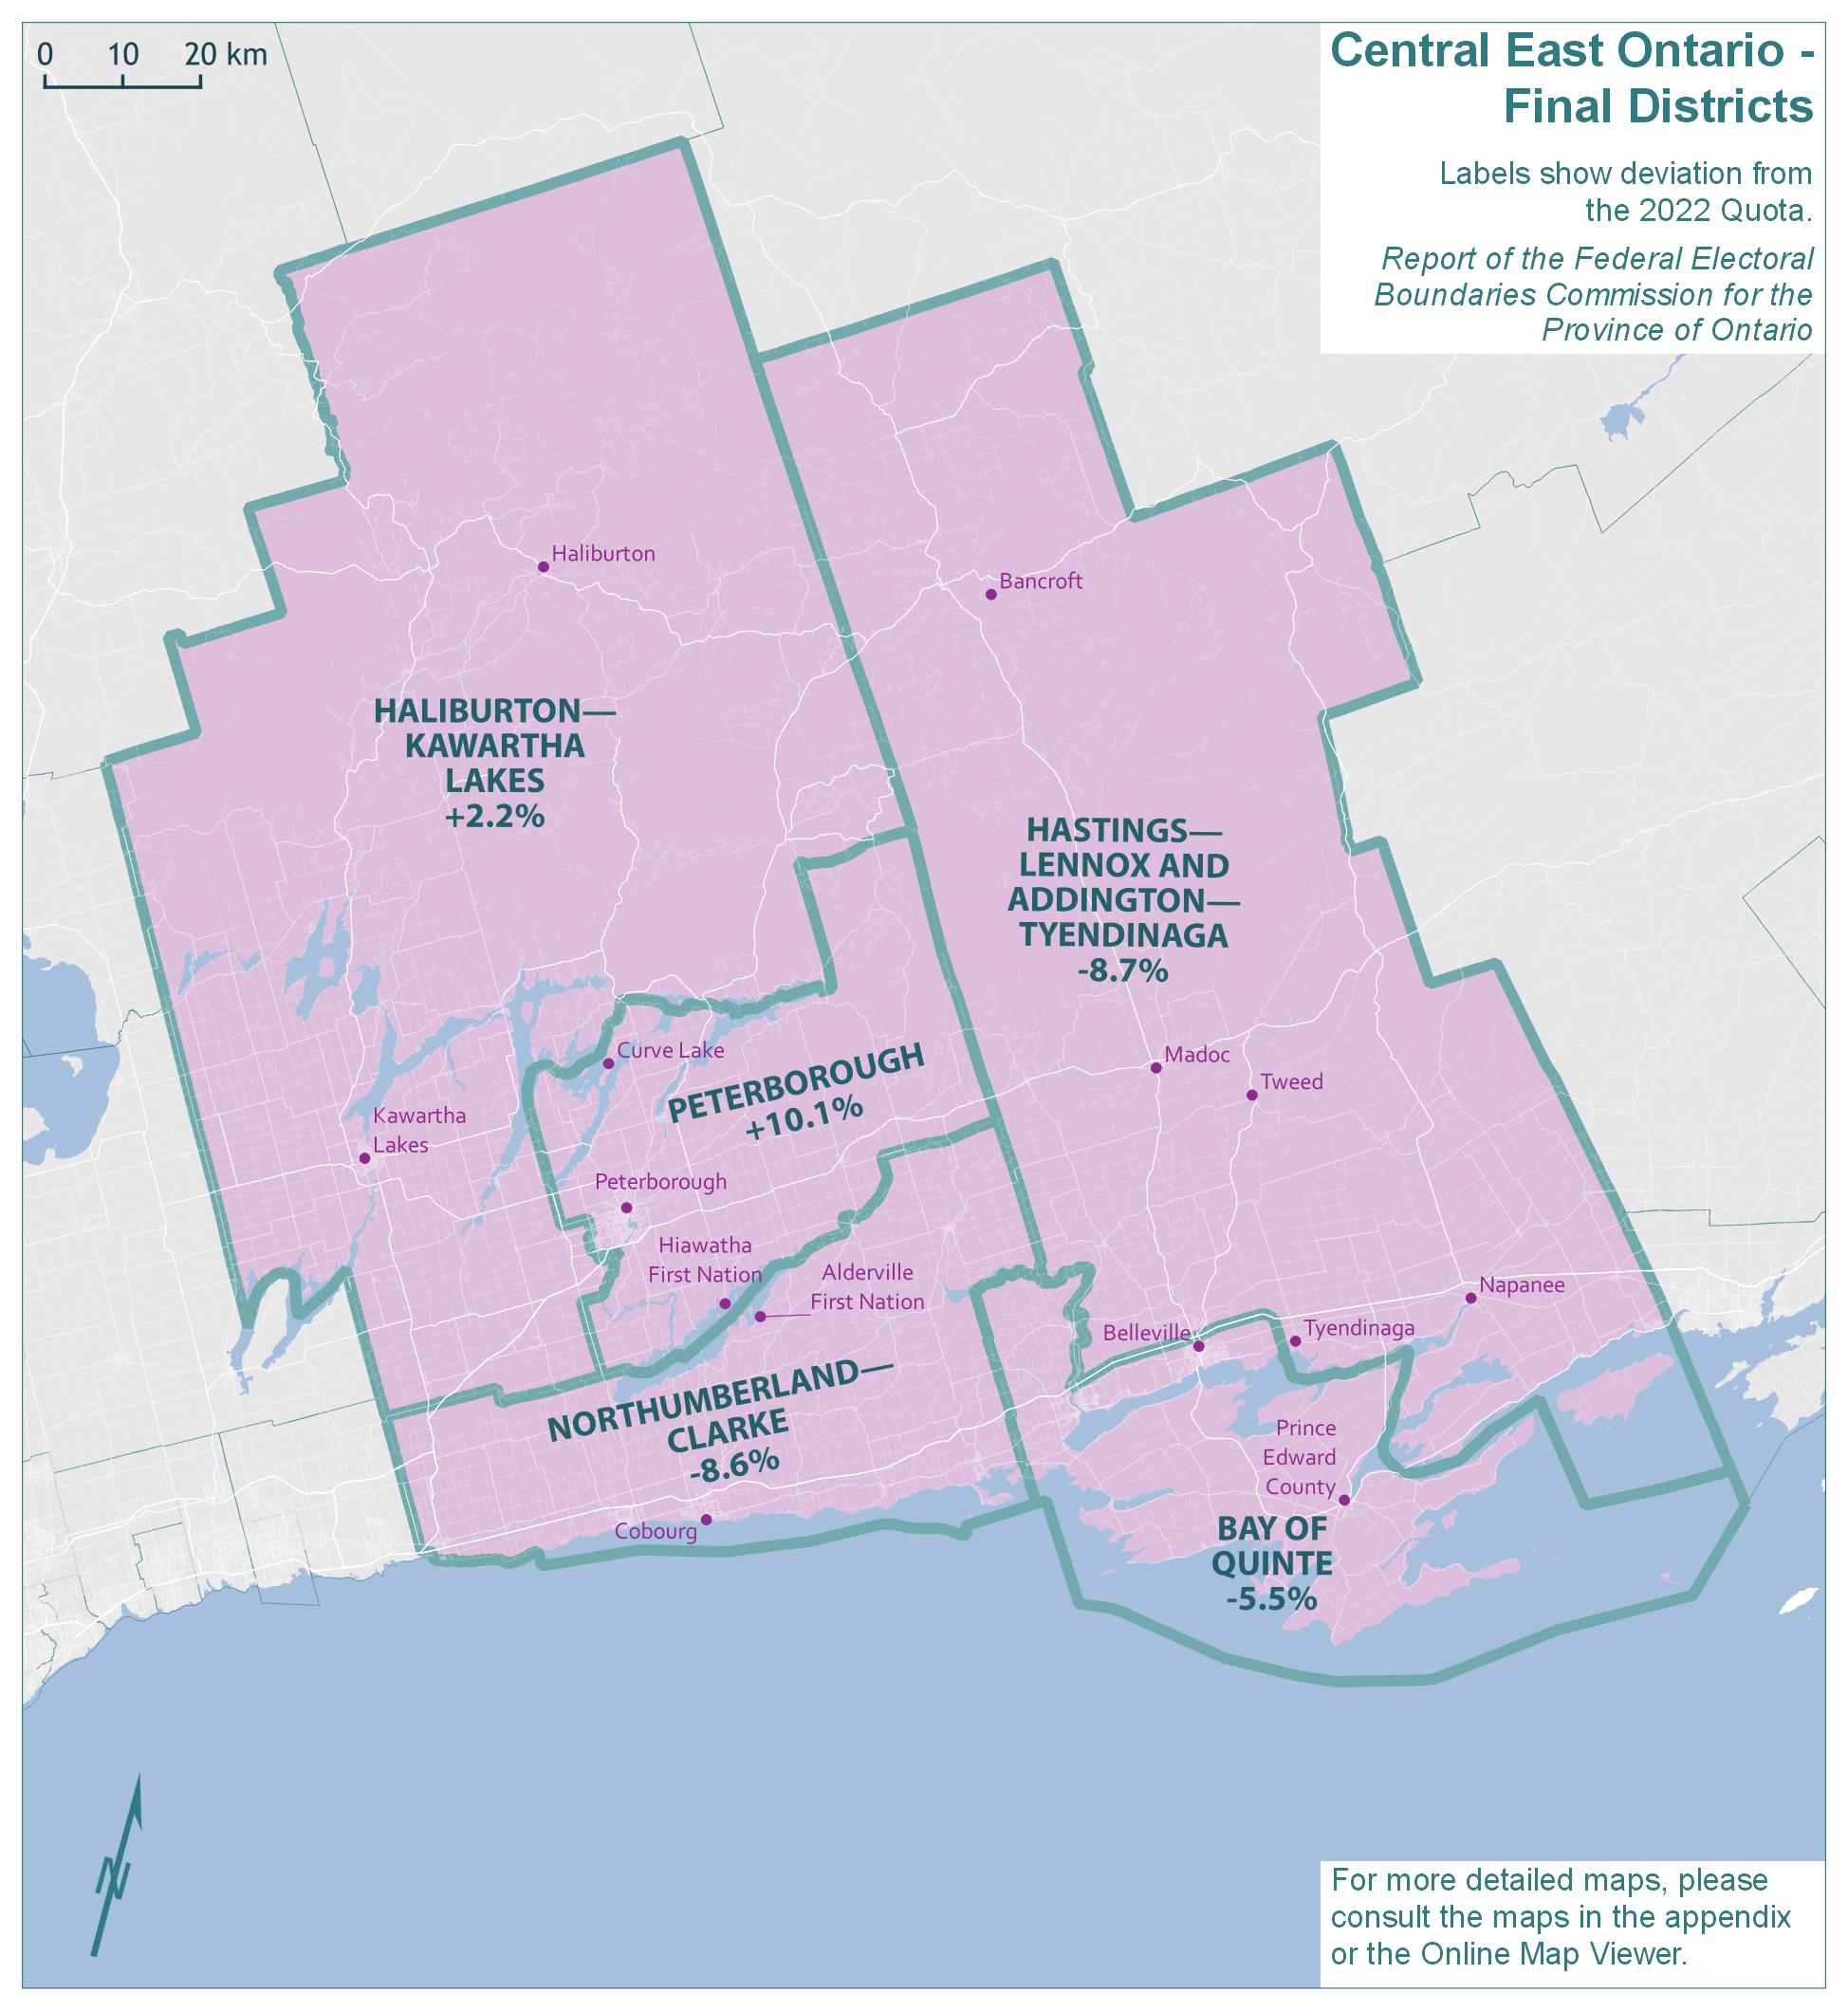
Text version of "Central East Ontario - Final Districts"
Labels show deviation from the 2022 Quota.
Report of the Federal Electoral Boundaries Commission for the Province of Ontario
For more detailed maps, please consult the maps in the appendix or the Online Map Viewer.
| Electoral district | Deviation |
|---|---|
| Bay of Quinte | -5.5% |
| Haliburton—Kawartha Lakes | 2.2% |
| Hastings—Lennox and Addington—Tyendinaga | -8.7% |
| Northumberland—Clarke | -8.6% |
The population of Central East Ontario grew by 9%, from 535,322 in 2011 to 583,287 in 2021. The remainder of Ontario grew by 10.8% in the same period.
The existing five electoral districts in Central East Ontario would have an average 2021 population of 116,657 and an average deviation of 0.1% from the Quota. The absolute range between the least and most populous districts would be 21.3 percentage points. The populations and deviations from the Quota for the existing electoral districts are shown in Table 5A.
| Electoral Districts | Population – 2011 | Deviation from Quota – 2012 | Population – 2021 | Deviation from Quota – 2022 |
|---|---|---|---|---|
| Bay of Quinte | 109,488 | +3.08% | 116,016 | -0.49% |
| Haliburton—Kawartha Lakes—Brock | 110,217 | +3.77% | 122,401 | +4.98% |
| Hastings—Lennox and Addington | 92,513 | -12.90% | 100,636 | -13.68% |
| Northumberland—Peterborough South | 107,840 | +1.53% | 118,756 | +1.86% |
| Peterborough—Kawartha | 115,264 | +8.52% | 125,478 | +7.62% |
| Average | 107,064 | +0.80% | 116,657 | +0.06% |
| Range (most populous to least populous) | 22,751 | 21.42 pp | 24,842 | 21.30 pp |
pp = percentage points
In preparing the proposed redistribution plan for this geographic piece, the Commission noted that the existing electoral boundaries were problematic, particularly for the existing district of Hastings—Lennox and Addington, which had a deviation from the Quota of -13.7%.
As a result, the Commission shifted boundaries to balance the population of the districts across this geographic piece. The proposed populations and deviations from the Quota are shown in Table 5B.
| Electoral Districts | Population – 2021 | Deviation from Quota – 2022 |
|---|---|---|
| Bay of Quinte | 116,016 | -0.49% |
| Haliburton—Kawartha Lakes—Brock | 120,254 | +3.14% |
| Hastings—Lennox and Addington—Tyendinaga | 111,331 | -4.51% |
| Northumberland | 114,335 | -1.93% |
| Peterborough | 121,336 | +4.07% |
| Average | 116,654 | +0.06% |
| Range (most populous to least populous) | 10,005 | 8.58 pp |
pp = percentage points
The Commission proposed shifting the boundaries of the existing district of Peterborough—Kawartha southward based on submissions received during the initial consultation phases that stressed the established connection of the Township of Otonabee-South Monaghan with Peterborough. It was also noted that the Alderville First Nation has territory on both sides of Rice Lake, so the boundary was shifted further south to ensure all of Alderville First Nation's territory would be in the same district. The name Peterborough was proposed and will be maintained as the final district name, but its boundaries have been altered from the initial proposal, as described below.
We heard, over the course of public hearings, that this southward shift was inappropriate. The Commission was advised that the small portion of the proposed Peterborough district south of Rice Lake (comprising the hamlet of Roseneath and the main reserve of the Alderville First Nation) were more appropriately aligned with the district of Northumberland. This suggestion, which was initiated by the Township of Alnwick/Haldimand and the Alderville First Nation and supported by several other municipalities within Northumberland County, has been implemented by the Commission.
Relative to the foregoing change, there was support for dividing Clarington as proposed – that is maintaining Clarke as part of the Northumberland district (although others suggested that Clarington, which resulted from the merger of Clarke and Darlington, should not be divided).
The Commission accepted the suggestion that the name should include a reference to Clarke,
the Clarke township being the historical Durham County township which is now all of Ward 4 of Clarington. The name for the district will be Northumberland—Clarke.
With respect to other proposed changes impacting the Peterborough area, the Commission received some support for creating a more compact urban riding, while others expressed the desire for the existing boundaries to remain the same.
Residents from five municipalities within Peterborough County, with support from municipal officials, indicated a desire to be aligned with the City of Peterborough and ultimately be part of the Peterborough district. These are the Municipality of Trent Lakes, the Township of Havelock-Belmont-Methuen, the Township of Asphodel-Norwood, the Township of Otonabee-South Monaghan and the Township of North Kawartha.
The Commission was able to implement the request of two townships and the alternative request of a third township. Ultimately, the Commission concluded that the Township of Havelock-Belmont-Methuen, the Township of Asphodel-Norwood and the Township of Otonabee-South Monaghan be included within the Peterborough district.
The Township of North Kawartha and the Municipality of Trent Lakes are being moved into Haliburton—Kawartha Lakes. The Commission was unable to keep Trent Lakes and North Kawartha in Peterborough given that the district has a high deviation of 10.1%. It was decided that North Kawartha and Trent Lakes should go into Haliburton—Kawartha Lakes together, as this would create three Peterborough County municipalities within this district.
The Township of Cavan Monaghan is also being returned to the district of Haliburton—Kawartha Lakes, as it was in the existing districts. This was requested by the Township and residents. The Commission acknowledges that the proposed boundaries would have been problematic given that the Township was split into three districts.
Concern was also expressed that the proposed redistribution arbitrarily divided the Municipality of Highlands East. This municipality noted the value of maintaining political cohesion with Haliburton County with respect to federal policies affecting its region. The Commission implemented the suggestion, supported by other municipalities, to maintain the whole of the Municipality of Highlands East in the district of Haliburton—Kawartha Lakes.
The Township of Brock has been moved to York—durham, aligning it with several other municipalities within the Regional Municipality of Durham. As a consequence of this, the new district name will be Haliburton—Kawartha Lakes.
These changes also resulted in a cascading effect on the Hastings—lennox And Addington—Tyendinaga and Bay of Quinte districts. The boundary between these districts was redrawn to divide the City of Quinte West on Highway 401 and the Trent River, in a similar manner to how Belleville has been historically divided, and to place rural portions of Quinte West in the riding of Hastings—lennox And Addington—Tyendinaga. Care has been taken to not divide the community of Frankford.
The names, populations and deviations from the Quota for Central East Ontario's final districts are shown in Table 5C.
| Electoral Districts | Population – 2021 | Deviation from Quota – 2022 |
|---|---|---|
| Bay of Quinte | 110,164 | -5.51% |
| Haliburton—Kawartha Lakes | 119,150 | +2.20% |
| Hastings—Lennox and Addington—Tyendinaga | 106,468 | -8.68% |
| Northumberland—Clarke | 106,574 | -8.59% |
| Peterborough | 128,349 | +10.09% |
| Average | 114,141 | -2.10% |
| Range (most populous to least populous) | 21,881 | 18.77 pp |
pp = percentage points
Central Ontario
Central Ontario - Existing Districts
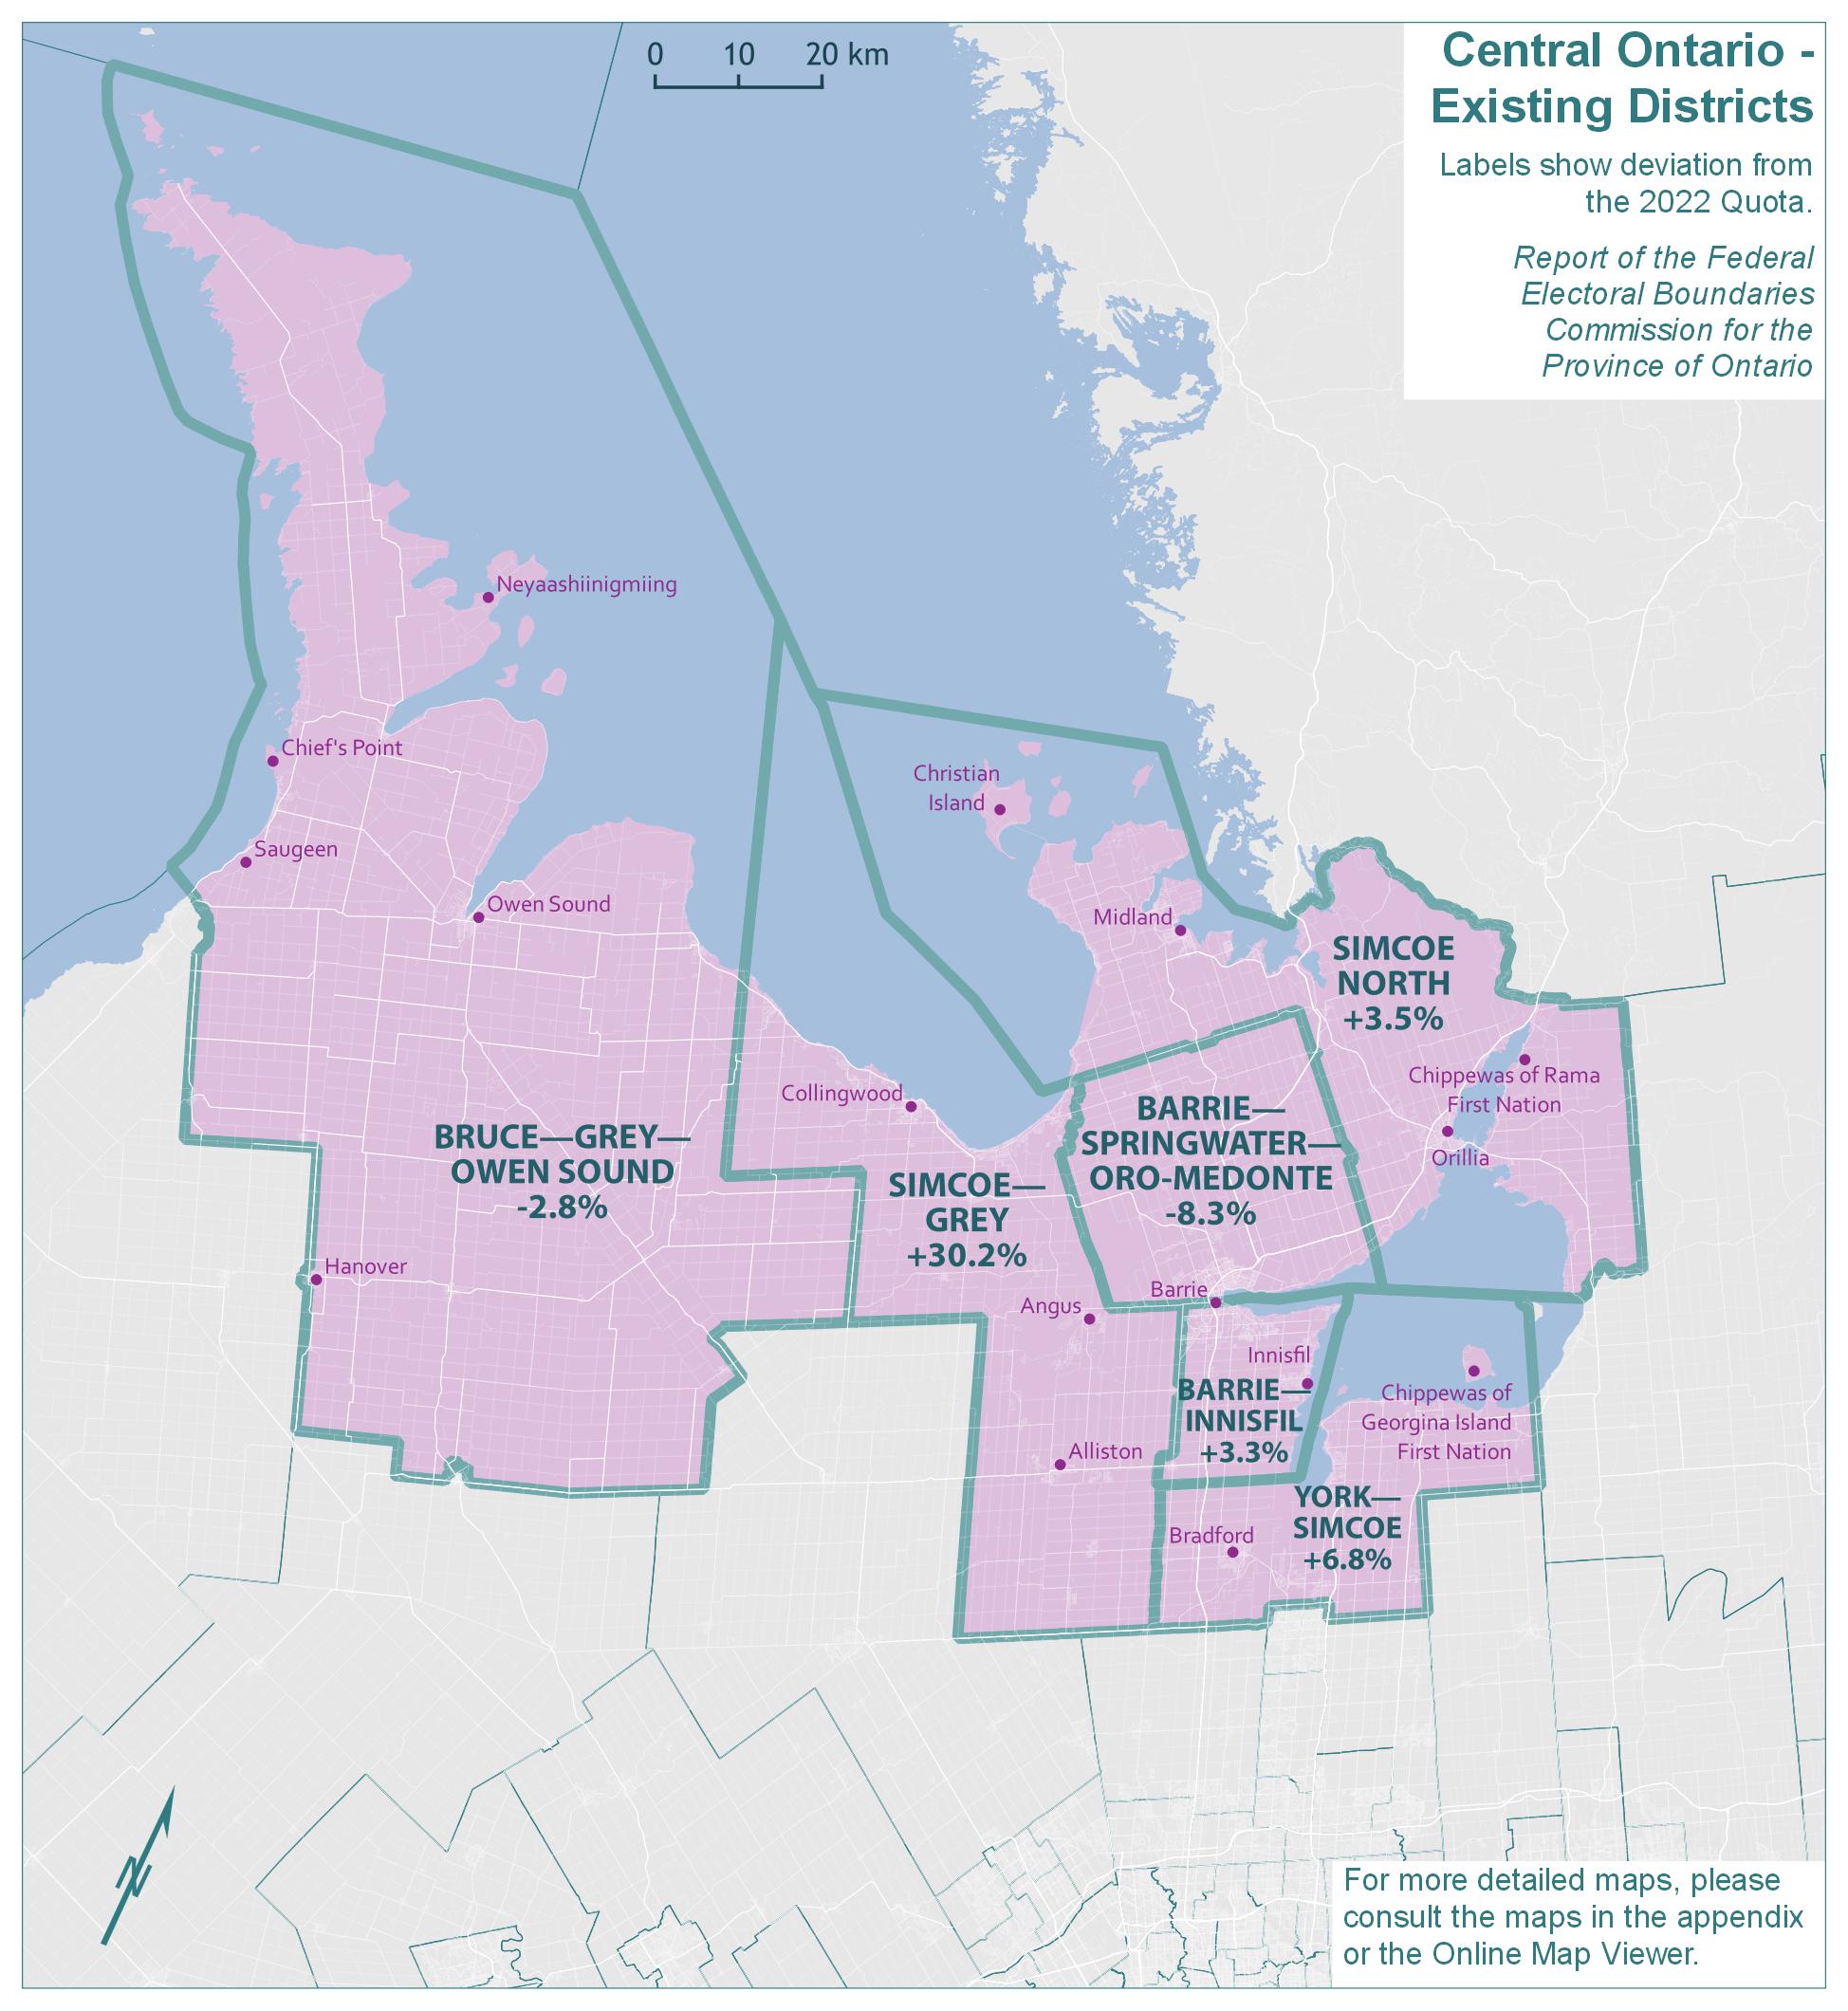
Text version of "Central Ontario - Existing Districts"
Labels show deviation from the 2022 Quota.
Report of the Federal Electoral Boundaries Commission for the Province of Ontario
For more detailed maps, please consult the maps in the appendix or the Online Map Viewer.
| Electoral district | Deviation |
|---|---|
| Barrie—Innisfil | 3.3% |
| Barrie—Springwater—Oro-Medonte | -8.3% |
| Bruce—Grey—Owen Sound | -2.8% |
| Simcoe North | 3.5% |
| Simcoe—Grey | 30.2% |
| York—Simcoe | 6.8% |
Central Ontario - Proposed Districts
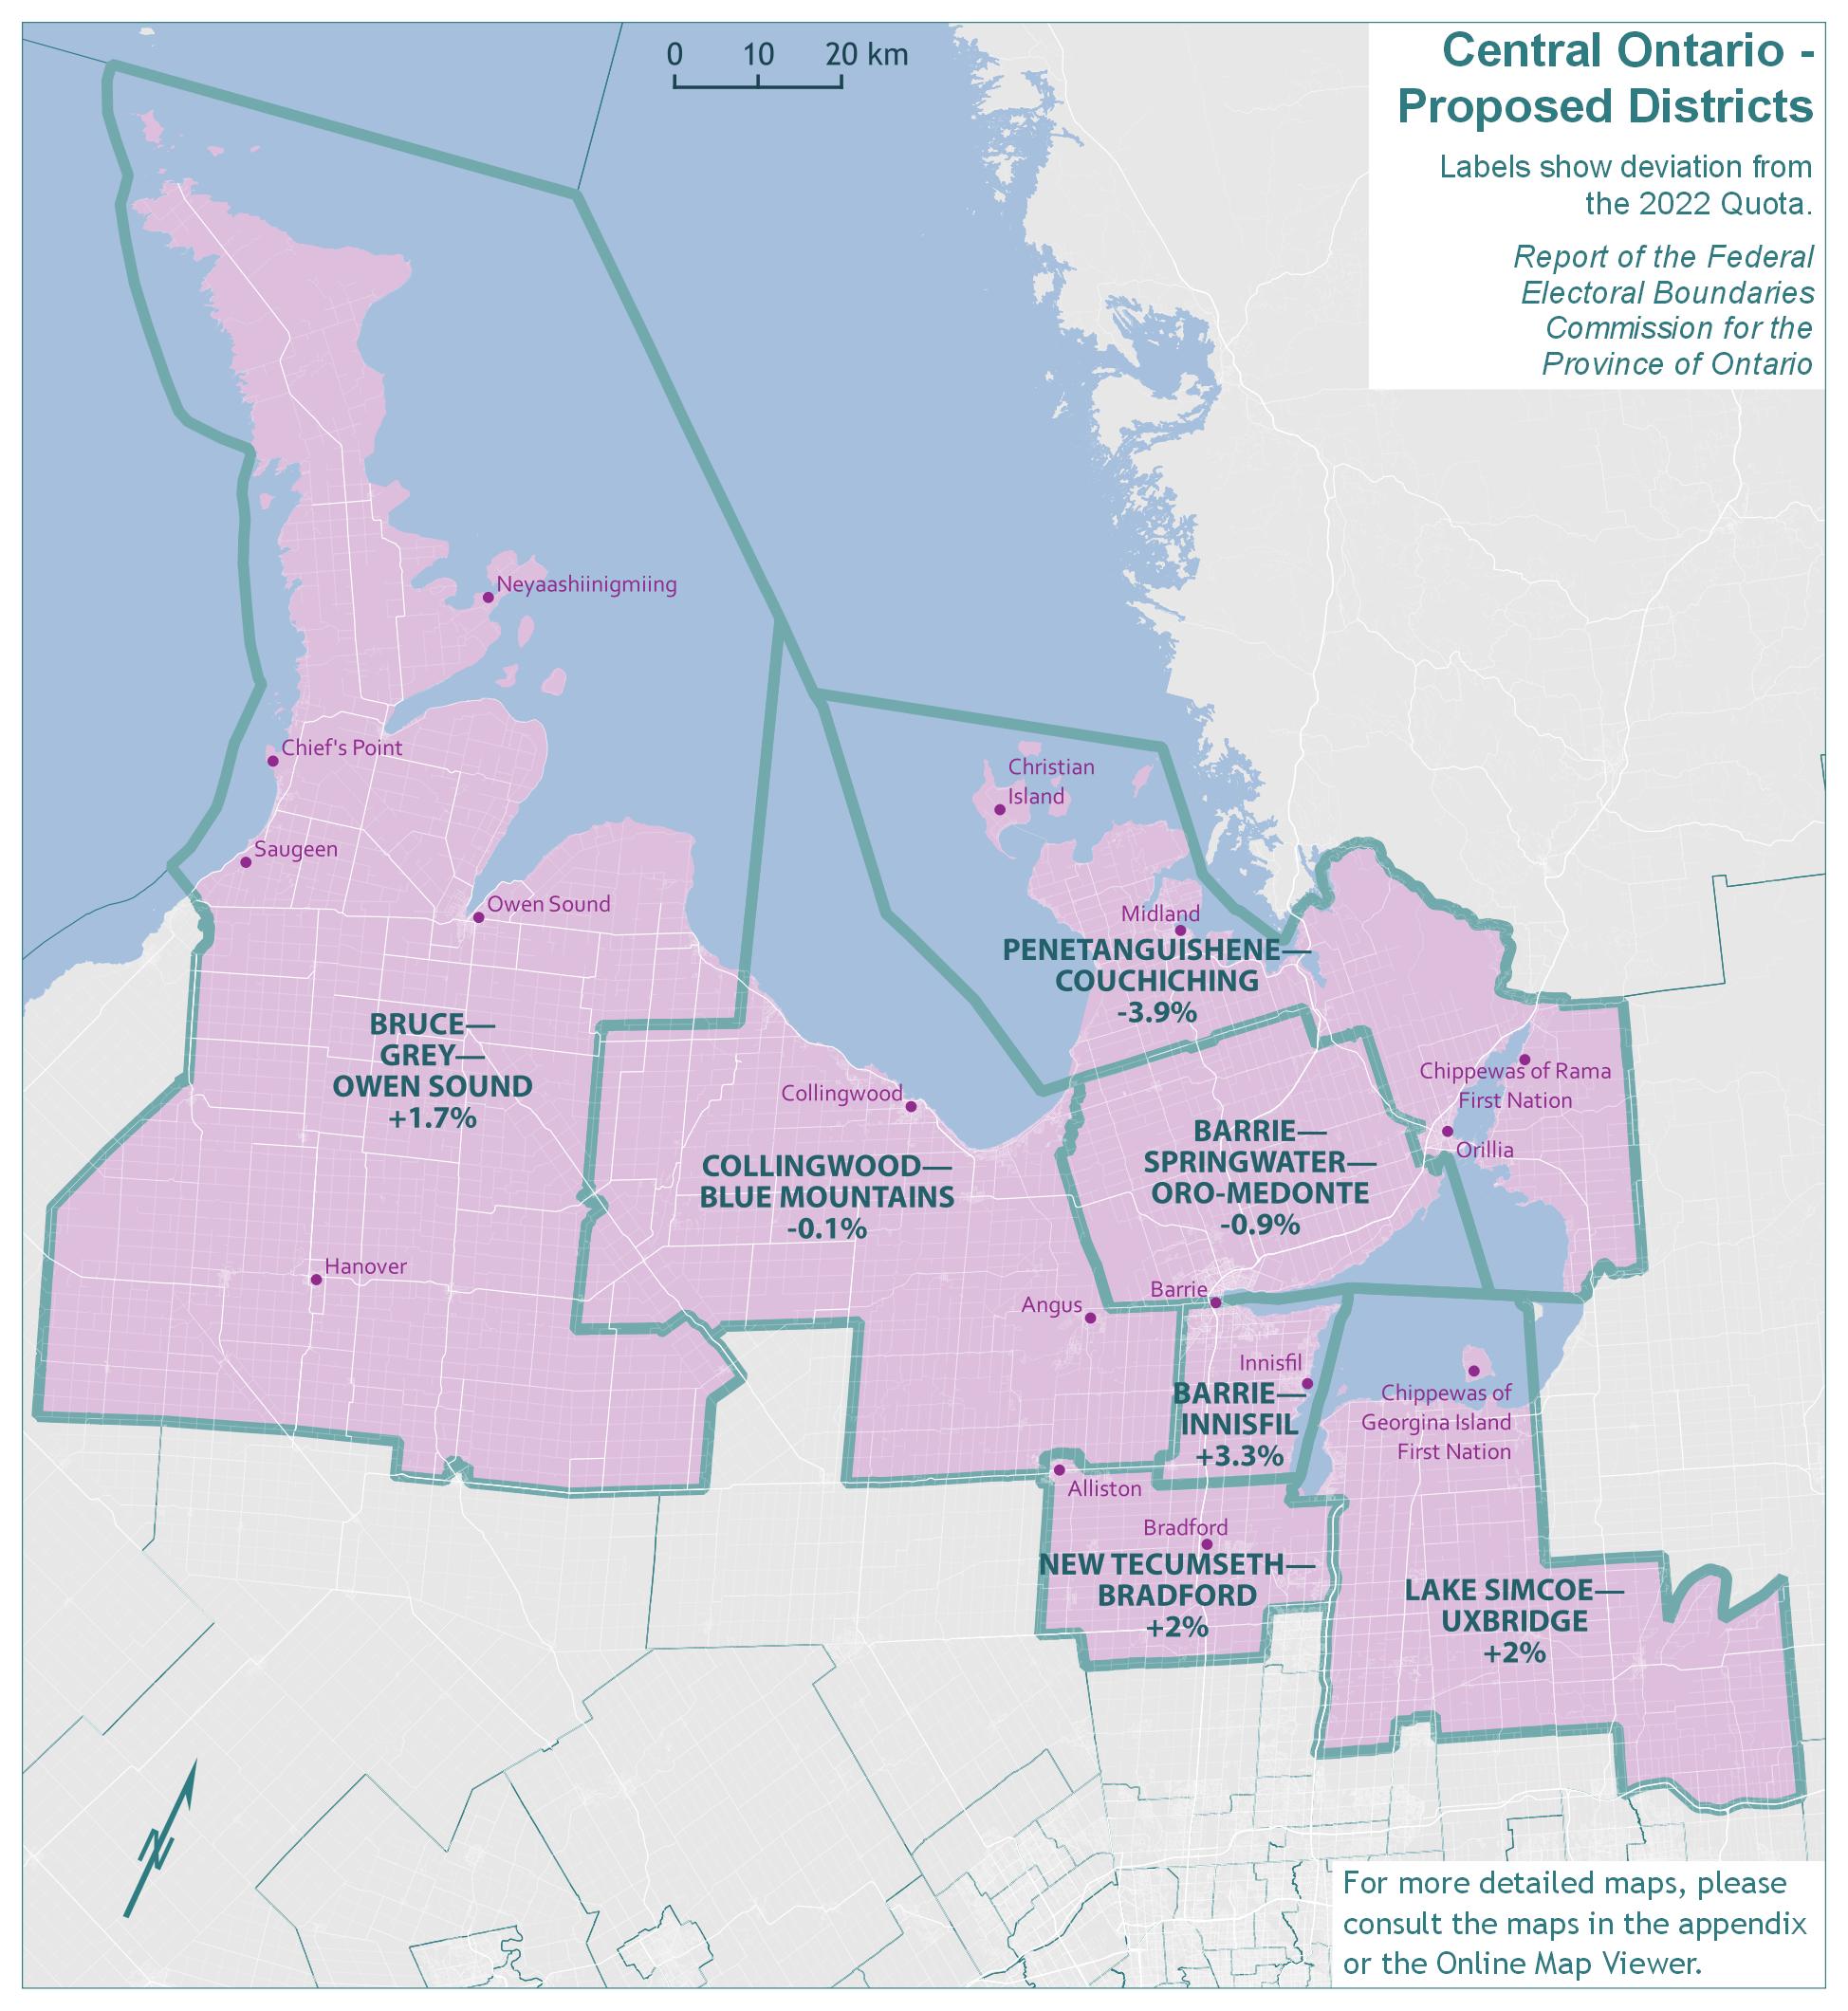
Text version of "Central Ontario - Proposed Districts"
Labels show deviation from the 2022 Quota.
Report of the Federal Electoral Boundaries Commission for the Province of Ontario
For more detailed maps, please consult the maps in the appendix or the Online Map Viewer.
| Electoral district | Deviation |
|---|---|
| Barrie—Innisfil | 3.3% |
| Barrie—Springwater—Oro-Medonte | -0.9% |
| Bruce—Grey—Owen Sound | 1.7% |
| Collingwood—Blue Mountains | -0.1% |
| Lake Simcoe—Uxbridge | 2.0% |
| New Tecumseth—Bradford | 2.0% |
| Penetanguishene—Couchiching | -3.9% |
Central Ontario - Final Districts
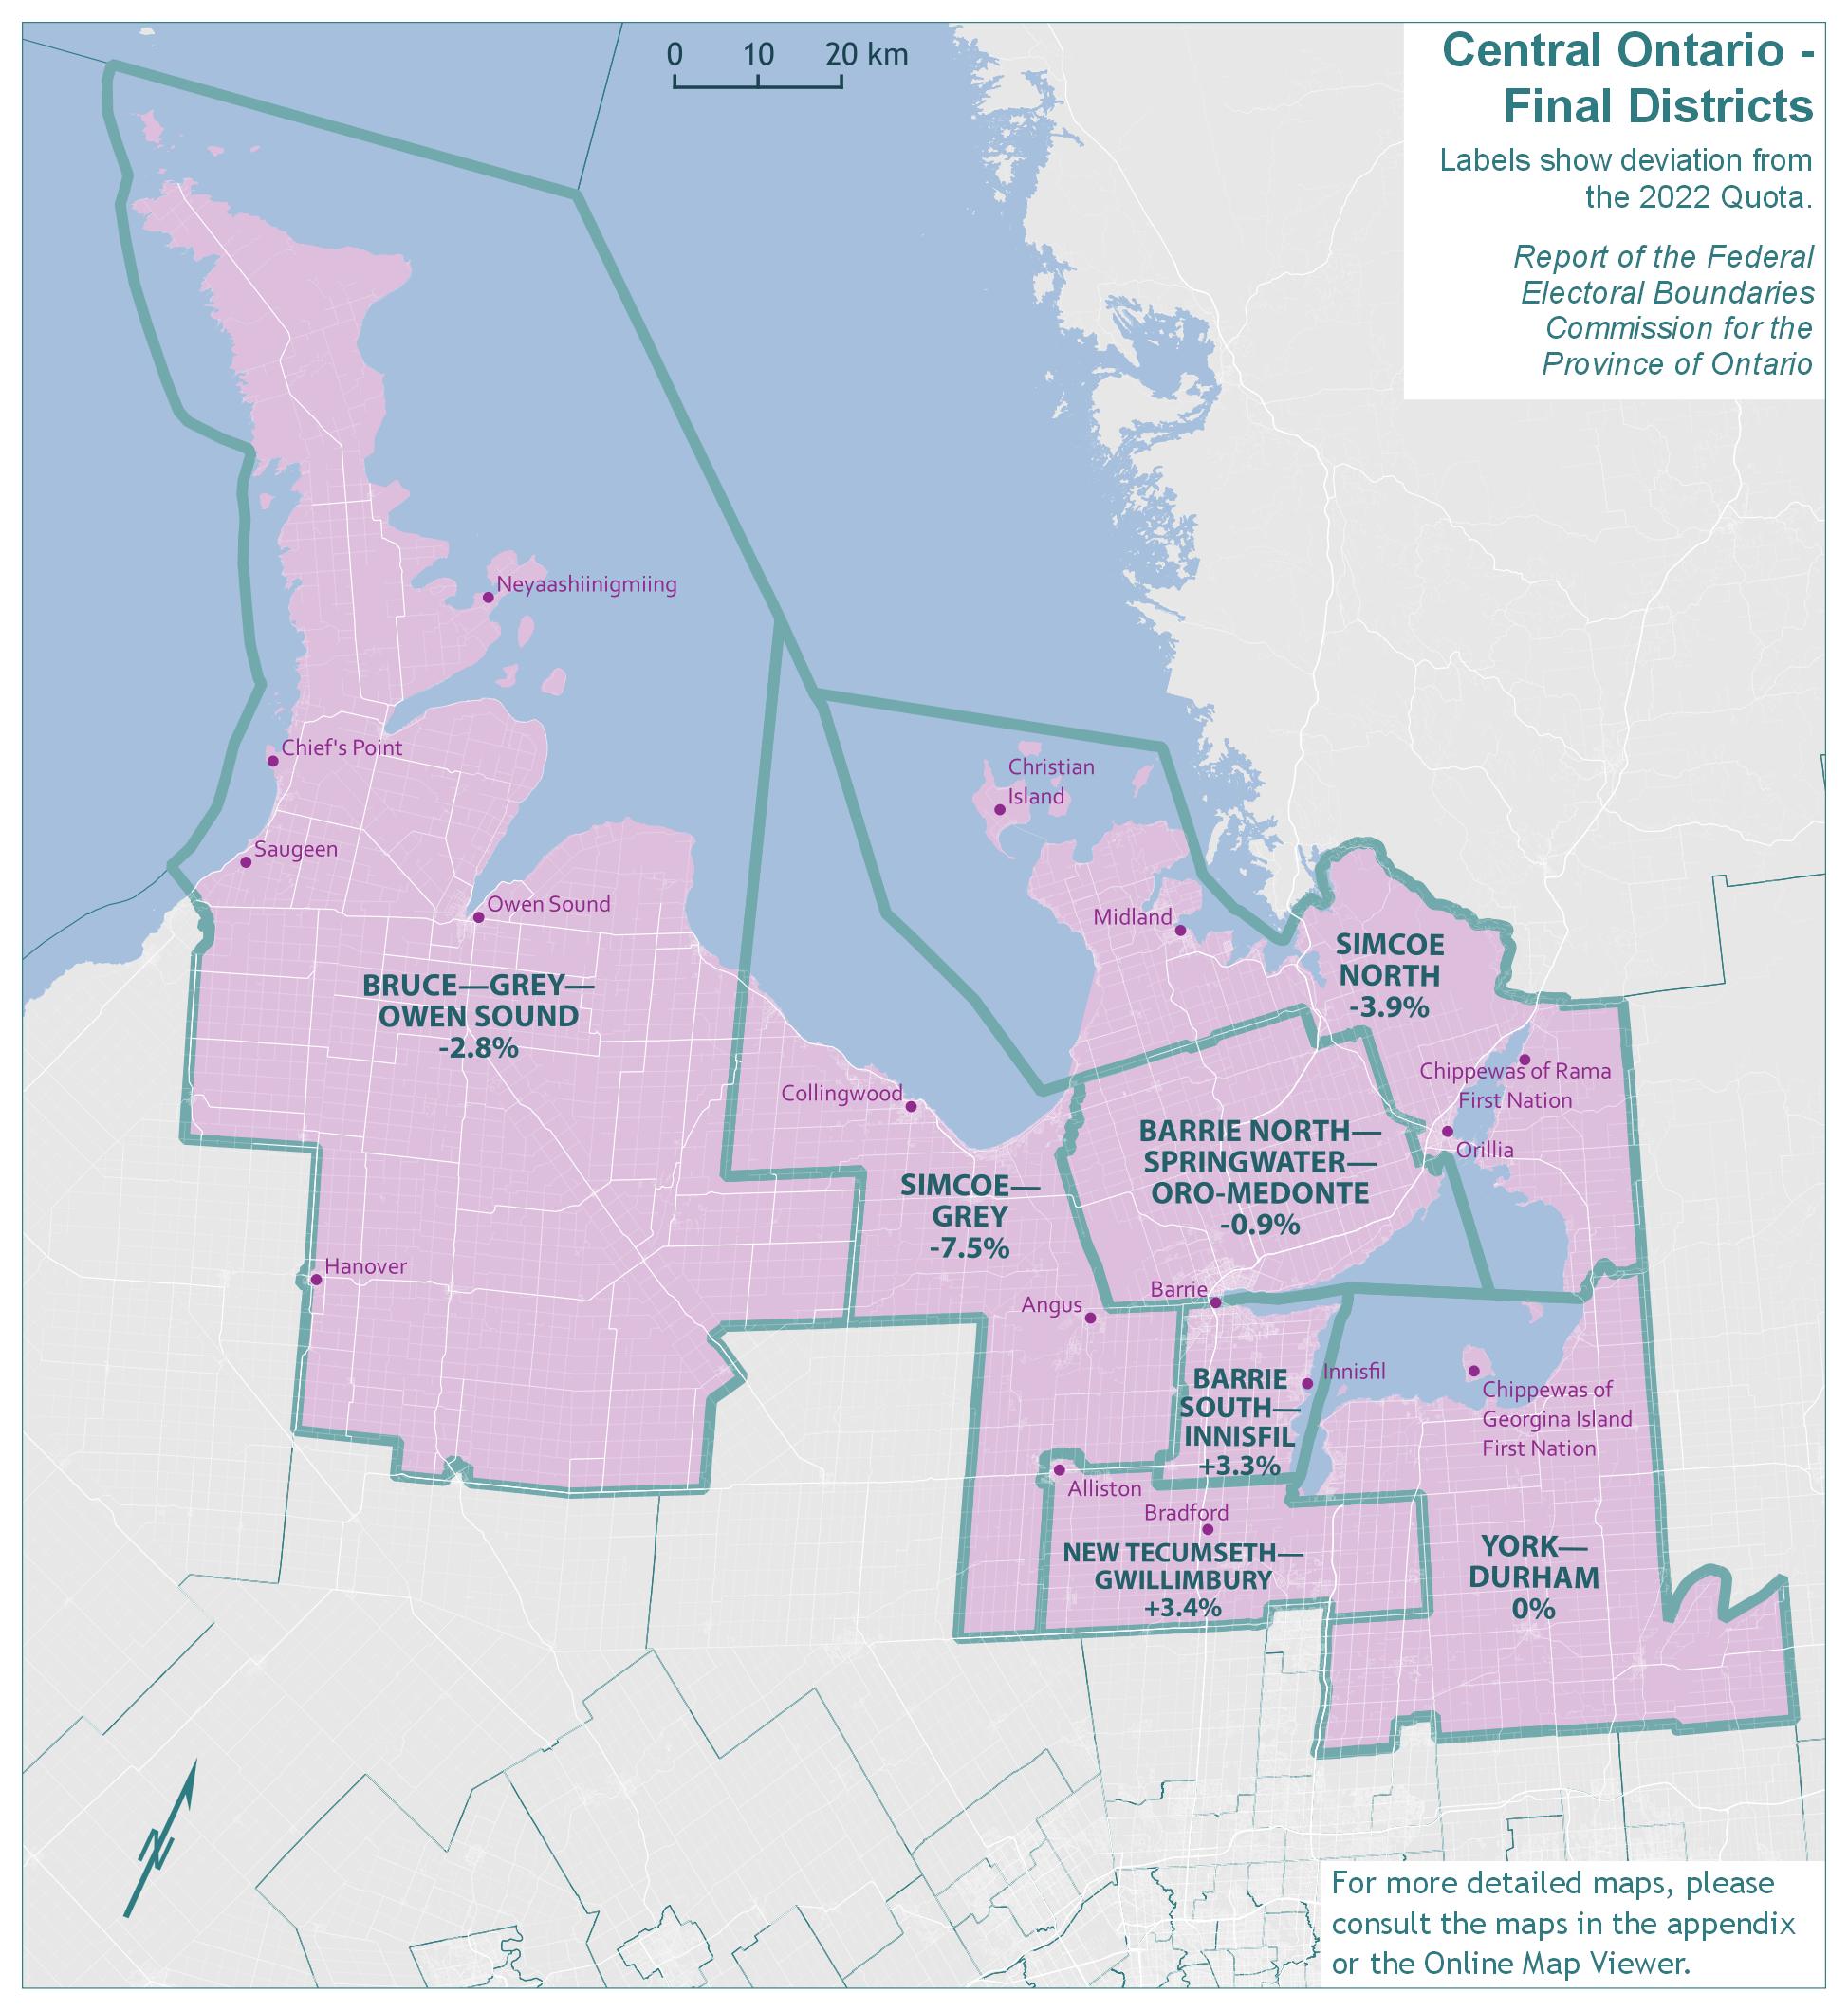
Text version of "Central Ontario - Final Districts"
Labels show deviation from the 2022 Quota.
Report of the Federal Electoral Boundaries Commission for the Province of Ontario
For more detailed maps, please consult the maps in the appendix or the Online Map Viewer.
| Electoral district | Deviation |
|---|---|
| Barrie North—Springwater—Oro-Medonte | -0.9% |
| Barrie South—Innisfil | 3.3% |
| Bruce—Grey—Owen Sound | -2.8% |
| New Tecumseth—Gwillimbury | 3.4% |
| Simcoe North | -3.9% |
| Simcoe—Grey | -7.5% |
| York—Durham | 0% |
The population of Central Ontario grew by 17.9%, from 625,530 in 2011 to 737,495 in 2021. The remainder of Ontario grew by 10.3% in the same period.
The existing six electoral districts in Central Ontario have an average 2021 population of 122,916 and fall 5.4% above the Quota. As indicated by the deviation range (38.5 percentage points), there are substantial disparities in the population size of districts. Simcoe—Grey has grown especially large, whereas other districts fall reasonably close to the 2022 Quota.
The populations and deviations from the Quota for the existing electoral districts are shown in Table 6A.
| Electoral Districts | Population – 2011 | Deviation from Quota – 2012 | Population – 2021 | Deviation from Quota – 2022 |
|---|---|---|---|---|
| Barrie—Innisfil | 101,584 | -4.36% | 120,378 | +3.25% |
| Barrie—Springwater—Oro-Medonte | 97,876 | -7.85% | 106,871 | -8.34% |
| Bruce—Grey—Owen Sound | 106,475 | +0.25% | 113,348 | -2.78% |
| Simcoe—Grey | 116,307 | +9.50% | 151,784 | +30.19% |
| Simcoe North | 108,672 | +2.31% | 120,656 | +3.49% |
| York—Simcoe | 94,616 | -10.92% | 124,458 | +6.75% |
| Average | 104,255 | -1.85% | 122,916 | +5.43% |
| Range (most populous to least populous) | 21,691 | 20.42 pp | 44,913 | 38.53 pp |
pp = percentage points
A new proposed district, Lake Simcoe—Uxbridge, encompassed a portion of the existing district of York—Simcoe plus portions of the existing districts of Markham—Stouffville (which is part of Northern GTA), and Pickering—Uxbridge and Durham (which are part of Eastern GTA).
In addition to this new district in the proposed redistribution plan, boundaries were redrawn to balance the populations of the other six districts. In particular, the southern boundary of the existing district of Simcoe—Grey was shifted north, and it was proposed that this district be renamed Collingwood—Blue Mountains. The growing community of New Tecumseth was placed in a newly named district, New Tecumseth—Bradford.
The Commission also proposed a small adjustment made between Simcoe North and Barrie—Springwater—Oro-Medonte, aligning the boundary with the Township of Oro-Medonte's municipal limits. The proposed name for this district was Penetanguishene—Couchiching.
The populations and deviations from the Quota for the proposed districts are shown in Table 6B.
| Electoral Districts | Population – 2021 | Deviation from Quota – 2022 |
|---|---|---|
| Barrie—Innisfil | 120,378 | +3.25% |
| Barrie—Springwater—Oro-Medonte | 115,495 | -0.94% |
| Bruce—Grey—Owen Sound | 118,588 | +1.71% |
| Collingwood—Blue Mountains | 116,511 | -0.07% |
| Lake Simcoe—Uxbridge | 118,867 | +1.95% |
| New Tecumseth—Bradford | 118,958 | +2.03% |
| Penetanguishene—Couchiching | 112,022 | -3.92% |
| Average | 117,260 | +0.57% |
| Range (most populous to least populous) | 8,356 | 7.17 pp |
pp = percentage points
There were many submissions regarding the Commission's choice of names for districts in this geographic piece.
While there was some support for the proposed name Penetanguishene—Couchiching as a symbol of reconciliation, it was noted that the name did not reference the largest current Indigenous communities in the district. Further, there were extensive submissions emphasizing the historic nature of the original name, Simcoe North, which has been used since Confederation. The Commission concluded that the historic name of Simcoe North should be retained for this district.
The Commission received submissions, including a joint submission from two Members of Parliament from Barrie, urging greater geographic differentiation in the two proposed Barrie district names. The Commission accepted these practical suggestions and Barrie—Innisfil has been renamed Barrie South—Innisfil while Barrie—Springwater—Oro-Medonte has been renamed Barrie North—Springwater—Oro-Medonte.
The Commission also received submissions, from individuals and many municipal leaders and elected representatives, in opposition to the name Collingwood—Blue Mountains suggesting that this name was too narrow and specific to only the northwestern portion of the riding and does not reflect the makeup of the proposed riding. The Commission agreed with these submissions and concluded that the existing name, Simcoe—Grey, should be retained.
The Commission also received submissions criticizing the proposed new district's name of Lake Simcoe—Uxbridge. Submitters pointed out that this name is unclear and does not adequately represent the area captured by this district. The Commission has opted to change this district's name to York—durham, acknowledging that this district makes up parts of the Regional Municipalities of York and Durham and that both names have a long history of being used as district names.
There were also several submissions relating to boundaries. Some of these submissions have resulted in changes to the proposal.
While there were many submissions to the contrary, significant submissions, including from the Township itself, supported the inclusion of all the Township of Oro-Medonte within Barrie North—Springwater—Oro-Medonte, noting the effectiveness of advocacy with one, rather than two, Members of Parliament for this smaller municipality.
In addition, comparable submissions, from the Township and residents, were made requesting that the whole of the Township of Adjala-Tosorontio be included in the proposed Collingwood—Blue Mountains district (now Simcoe—Grey) to allow the maintenance of its established, effective and cohesive fiscal relationship with the upper-tier Simcoe County. The Township of Mulmur requested that it be placed in Dufferin—Caledon in order to align it with Dufferin County.
These requests to retain effective representation could be achieved without undue impact on the principle of voter parity.
For similar reasons, there was a submission from the Municipality and its residents that the Municipality of Grey Highlands not be included in the proposed Collingwood—Blue Mountains district (now Simcoe—Grey) because of its strong relationship with the upper-tier of Grey County and its eight other lower-tier municipalities, noting the successful collaboration in the delivery of many services and the momentum for federal and provincial government-supported initiatives. Retaining this community in the Bruce—Grey—Owen Sound electoral district would allow for more effective representation, and importantly would not unreasonably compromise voter parity.
Similarly, the Municipalities of South Bruce and Brockton have been moved to Huron—Bruce. This means that Bruce—Grey—Owen Sound has been returned to its existing boundaries.
In the eastern portion of this geographic piece, changes have also been made to the proposed district of Lake Simcoe—Uxbridge, which is being renamed York—durham. Changes have been made in order to avoid splitting municipalities, to align municipalities with their upper-tier municipalities and to improve voter parity.
In particular, the Township of Brock was moved to this district to alleviate population pressure on Haliburton—Kawartha Lakes and also to align it with the Regional Municipality of Durham. Other changes have been made to match the boundary with Clarington, Oshawa, and East Gwillimbury's municipal limits, limiting the number of districts that these cities are split across.
East Gwillimbury has been moved wholly into the proposed district of New Tecumseth—Bradford. Since the district now includes the entirety of both the Town of East Gwillimbury and the Town of Bradford West Gwillimbury (with one small exception south of Green Line), the Commission decided to rename the district New Tecumseth—Gwillimbury.
The names, populations and deviations from the Quota for Central Ontario's final districts are shown in Table 6C.
| Electoral Districts | Population – 2021 | Deviation from Quota – 2022 |
|---|---|---|
| Barrie North—Springwater—Oro-Medonte | 115,495 | -0.94% |
| Barrie South—Innisfil | 120,378 | +3.25% |
| Bruce—Grey—Owen Sound | 113,348 | -2.78% |
| New Tecumseth—Gwillimbury | 120,533 | +3.38% |
| Simcoe—Grey | 107,836 | -7.51% |
| Simcoe North | 112,022 | -3.92% |
| York—Durham | 116,560 | -0.03% |
| Average | 115,167 | -1.22% |
| Range (most populous to least populous) | 12,697 | 10.89 pp |
pp = percentage points
Eastern Greater Toronto Area (GTA)
Eastern Greater Toronto Area (GTA) - Existing Districts
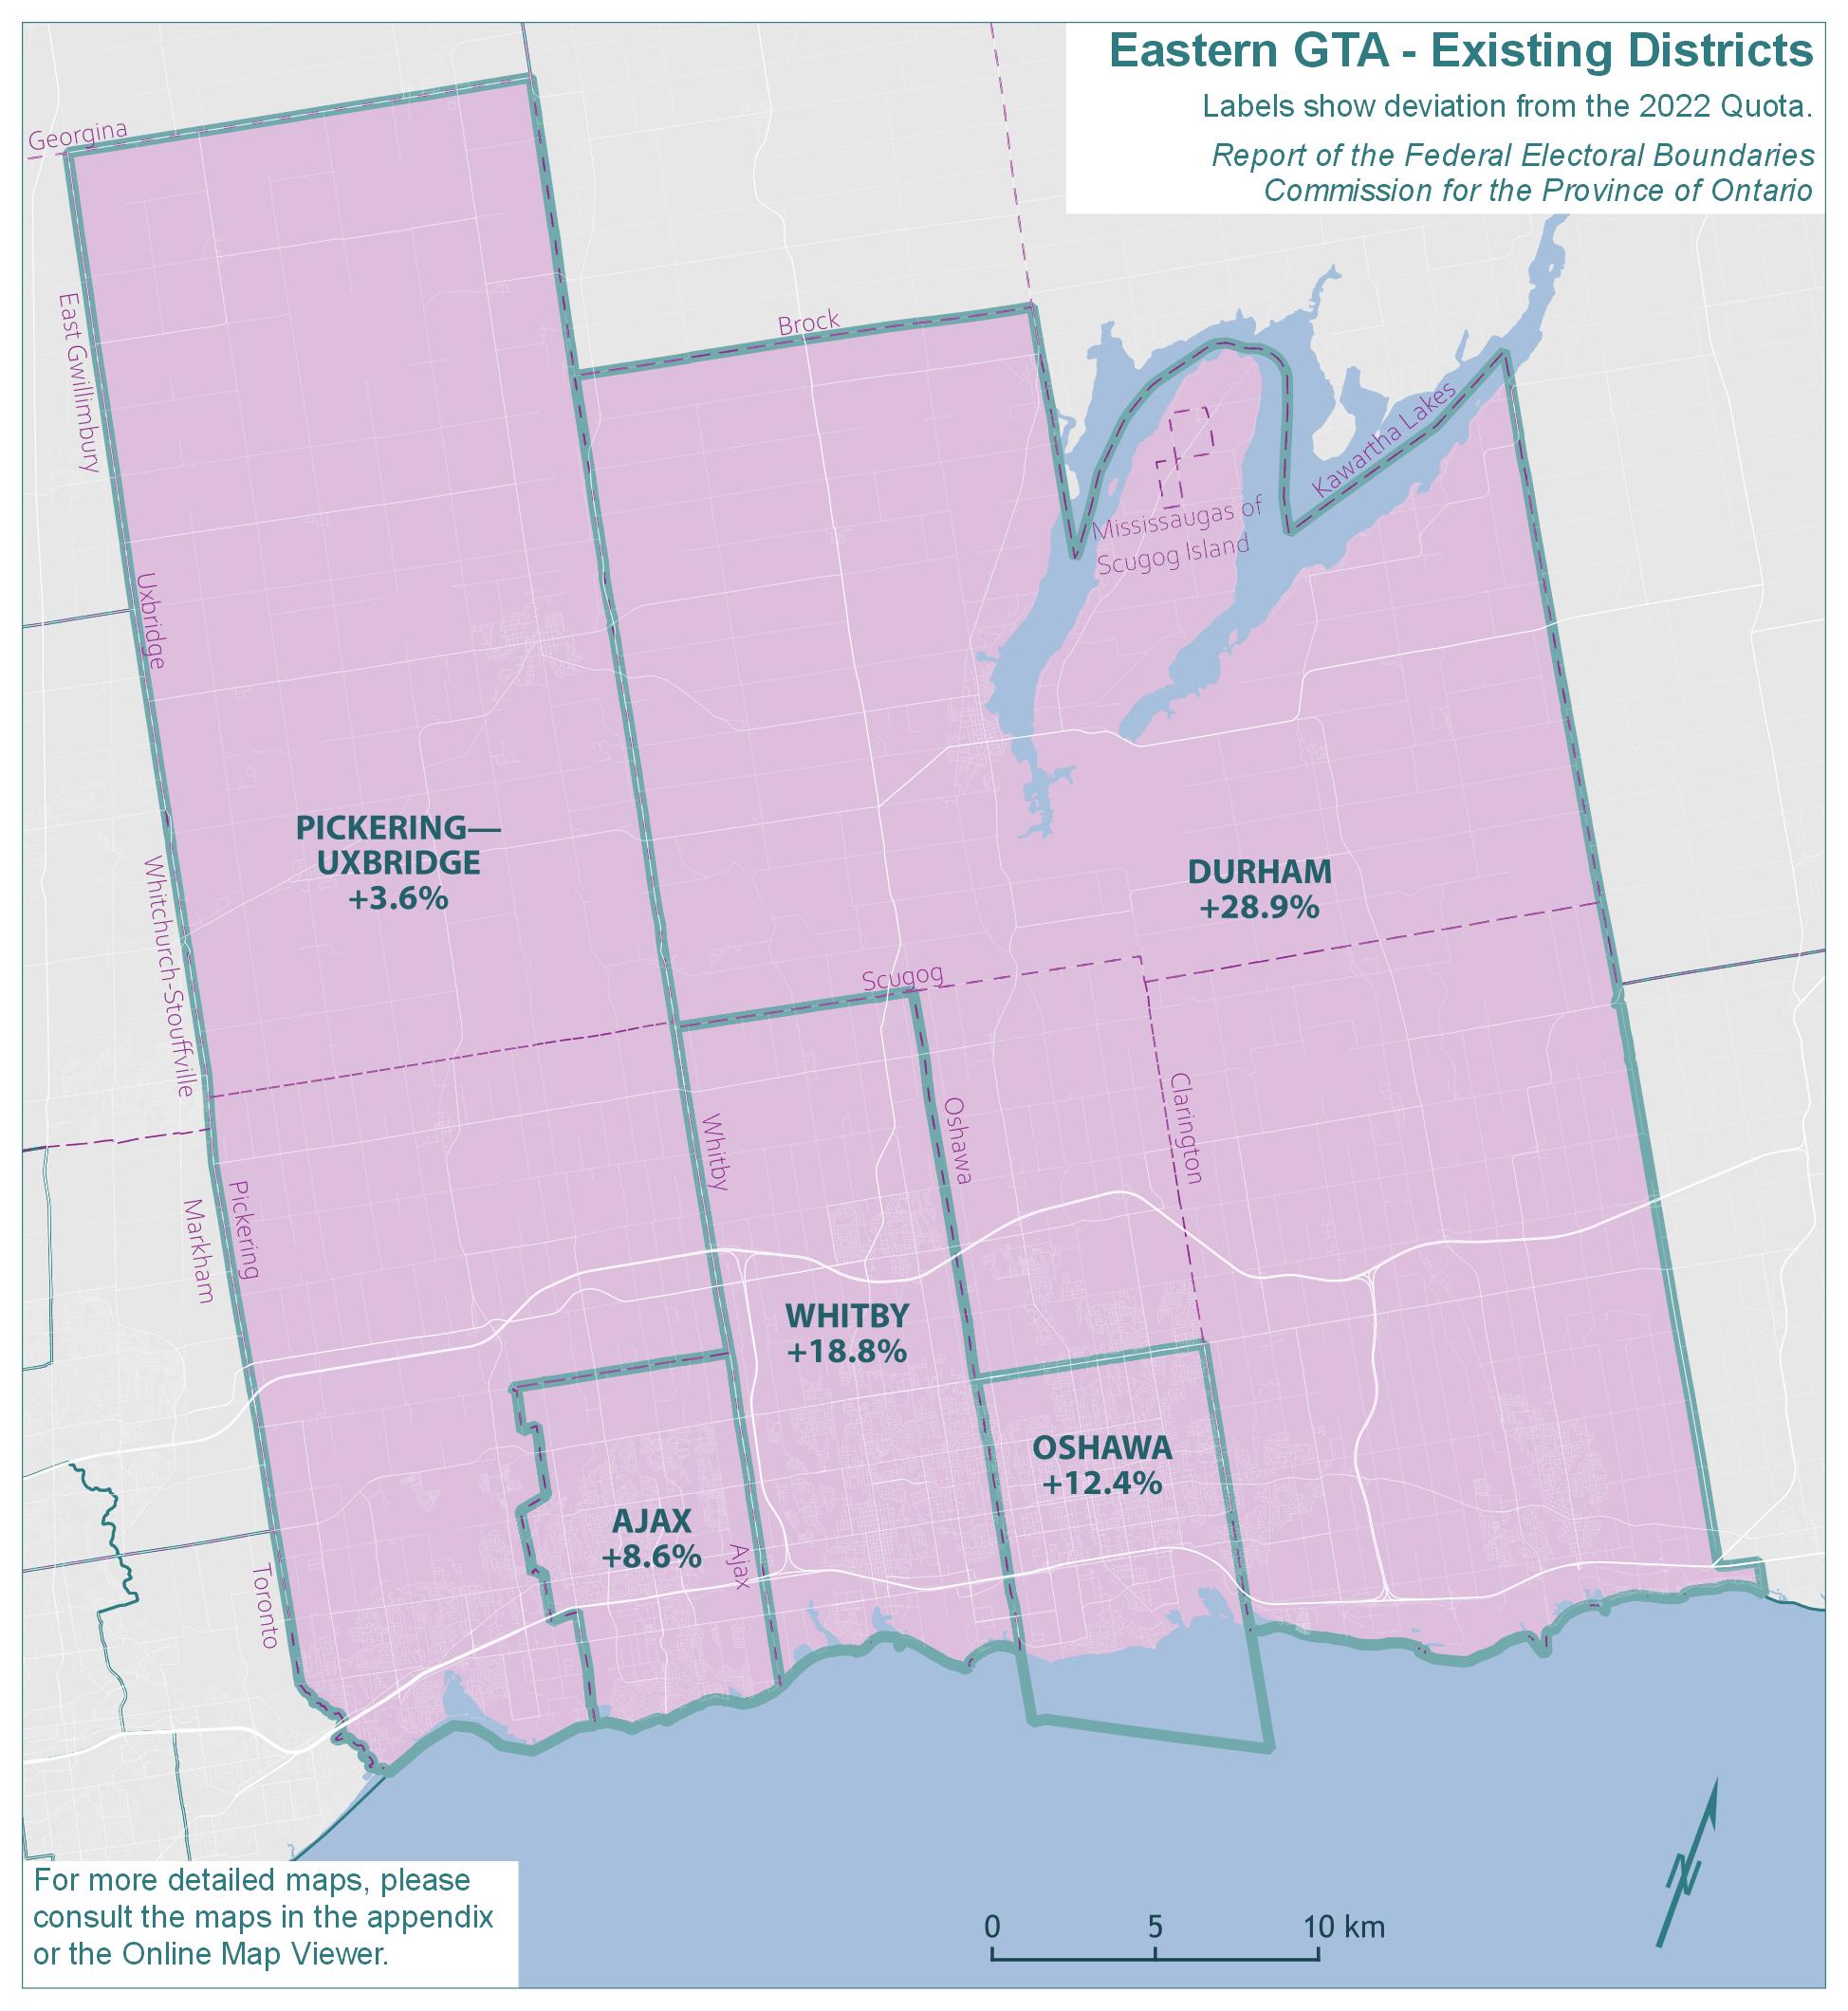
Text version of "Eastern Greater Toronto Area (GTA) - Existing Districts"
Labels show deviation from the 2022 Quota.
Report of the Federal Electoral Boundaries Commission for the Province of Ontario
For more detailed maps, please consult the maps in the appendix or the Online Map Viewer.
| Electoral district | Deviation |
|---|---|
| Ajax | 8.6% |
| Durham | 28.9% |
| Oshawa | 12.4% |
| Pickering—Uxbridge | 3.6% |
| Whitby | 18.8% |
Eastern Greater Toronto Area (GTA) - Proposed Districts
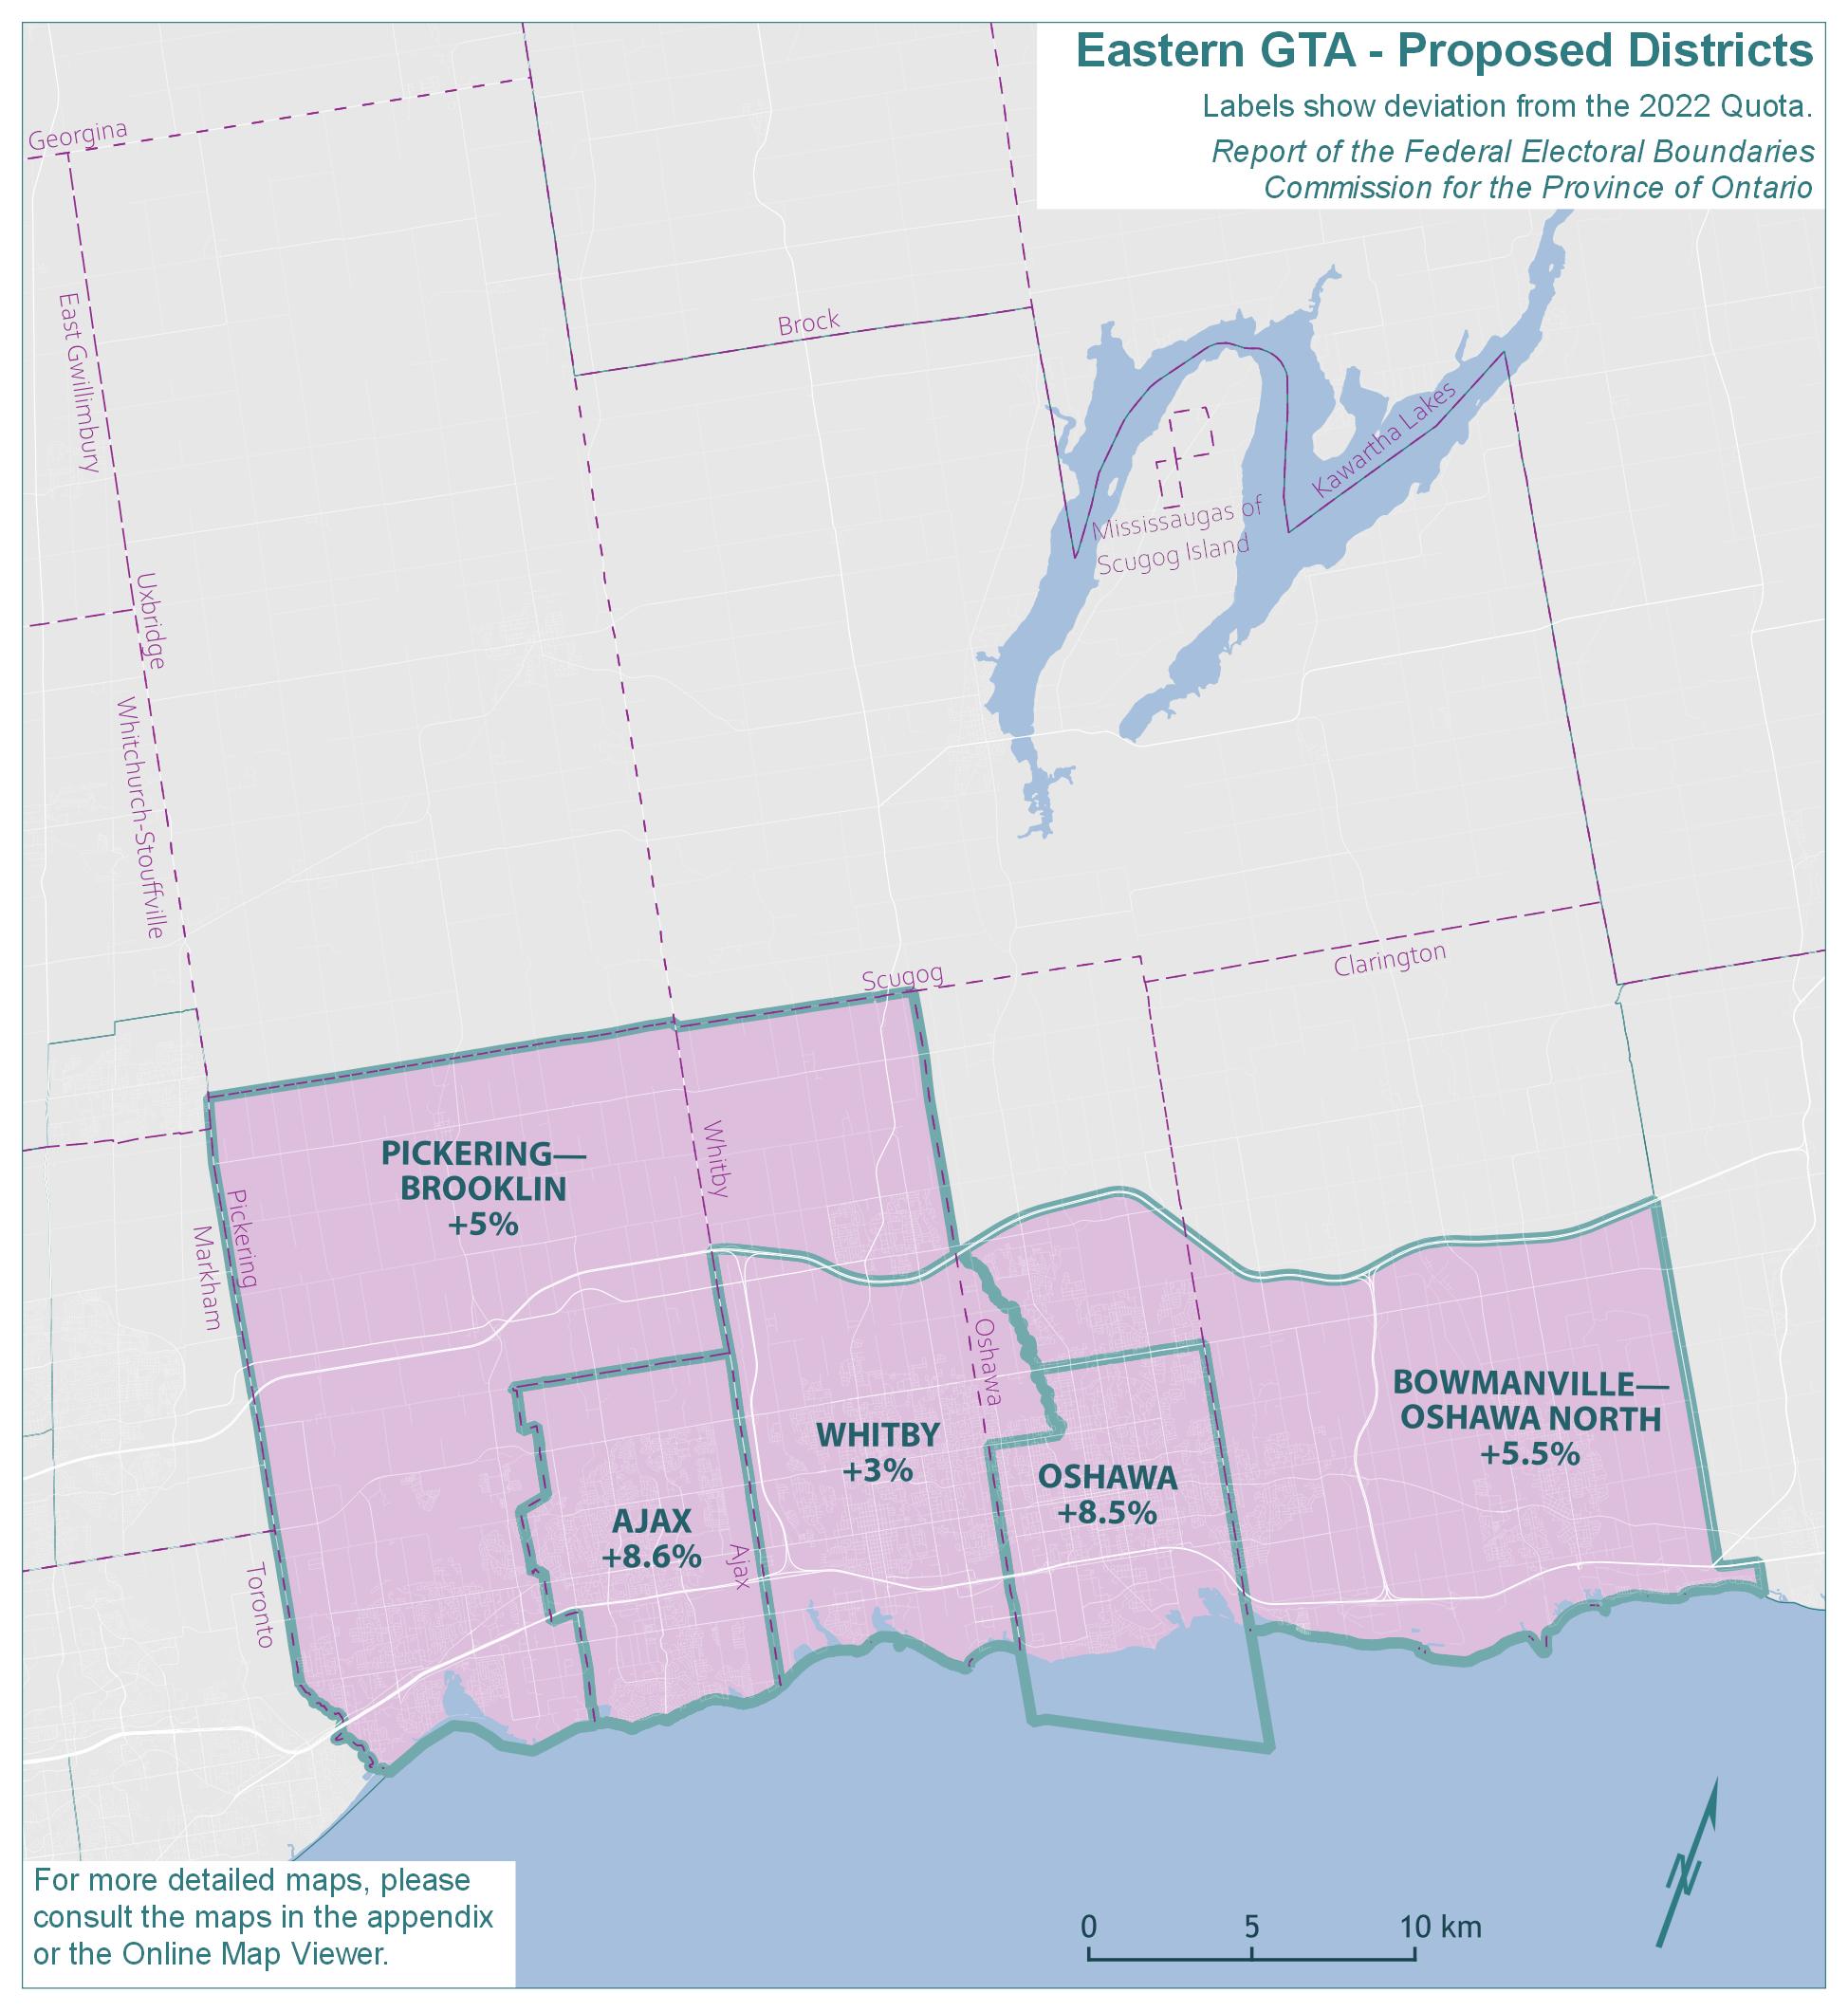
Text version of "Eastern Greater Toronto Area (GTA) - Proposed Districts"
Labels show deviation from the 2022 Quota.
Report of the Federal Electoral Boundaries Commission for the Province of Ontario
For more detailed maps, please consult the maps in the appendix or the Online Map Viewer.
| Electoral district | Deviation |
|---|---|
| Ajax | 8.6% |
| Bowmanville—Oshawa North | 5.5% |
| Oshawa | 8.5% |
| Pickering—Brooklin | 5.0% |
| Whitby | 3.0% |
Eastern Greater Toronto Area (GTA) - Final Districts
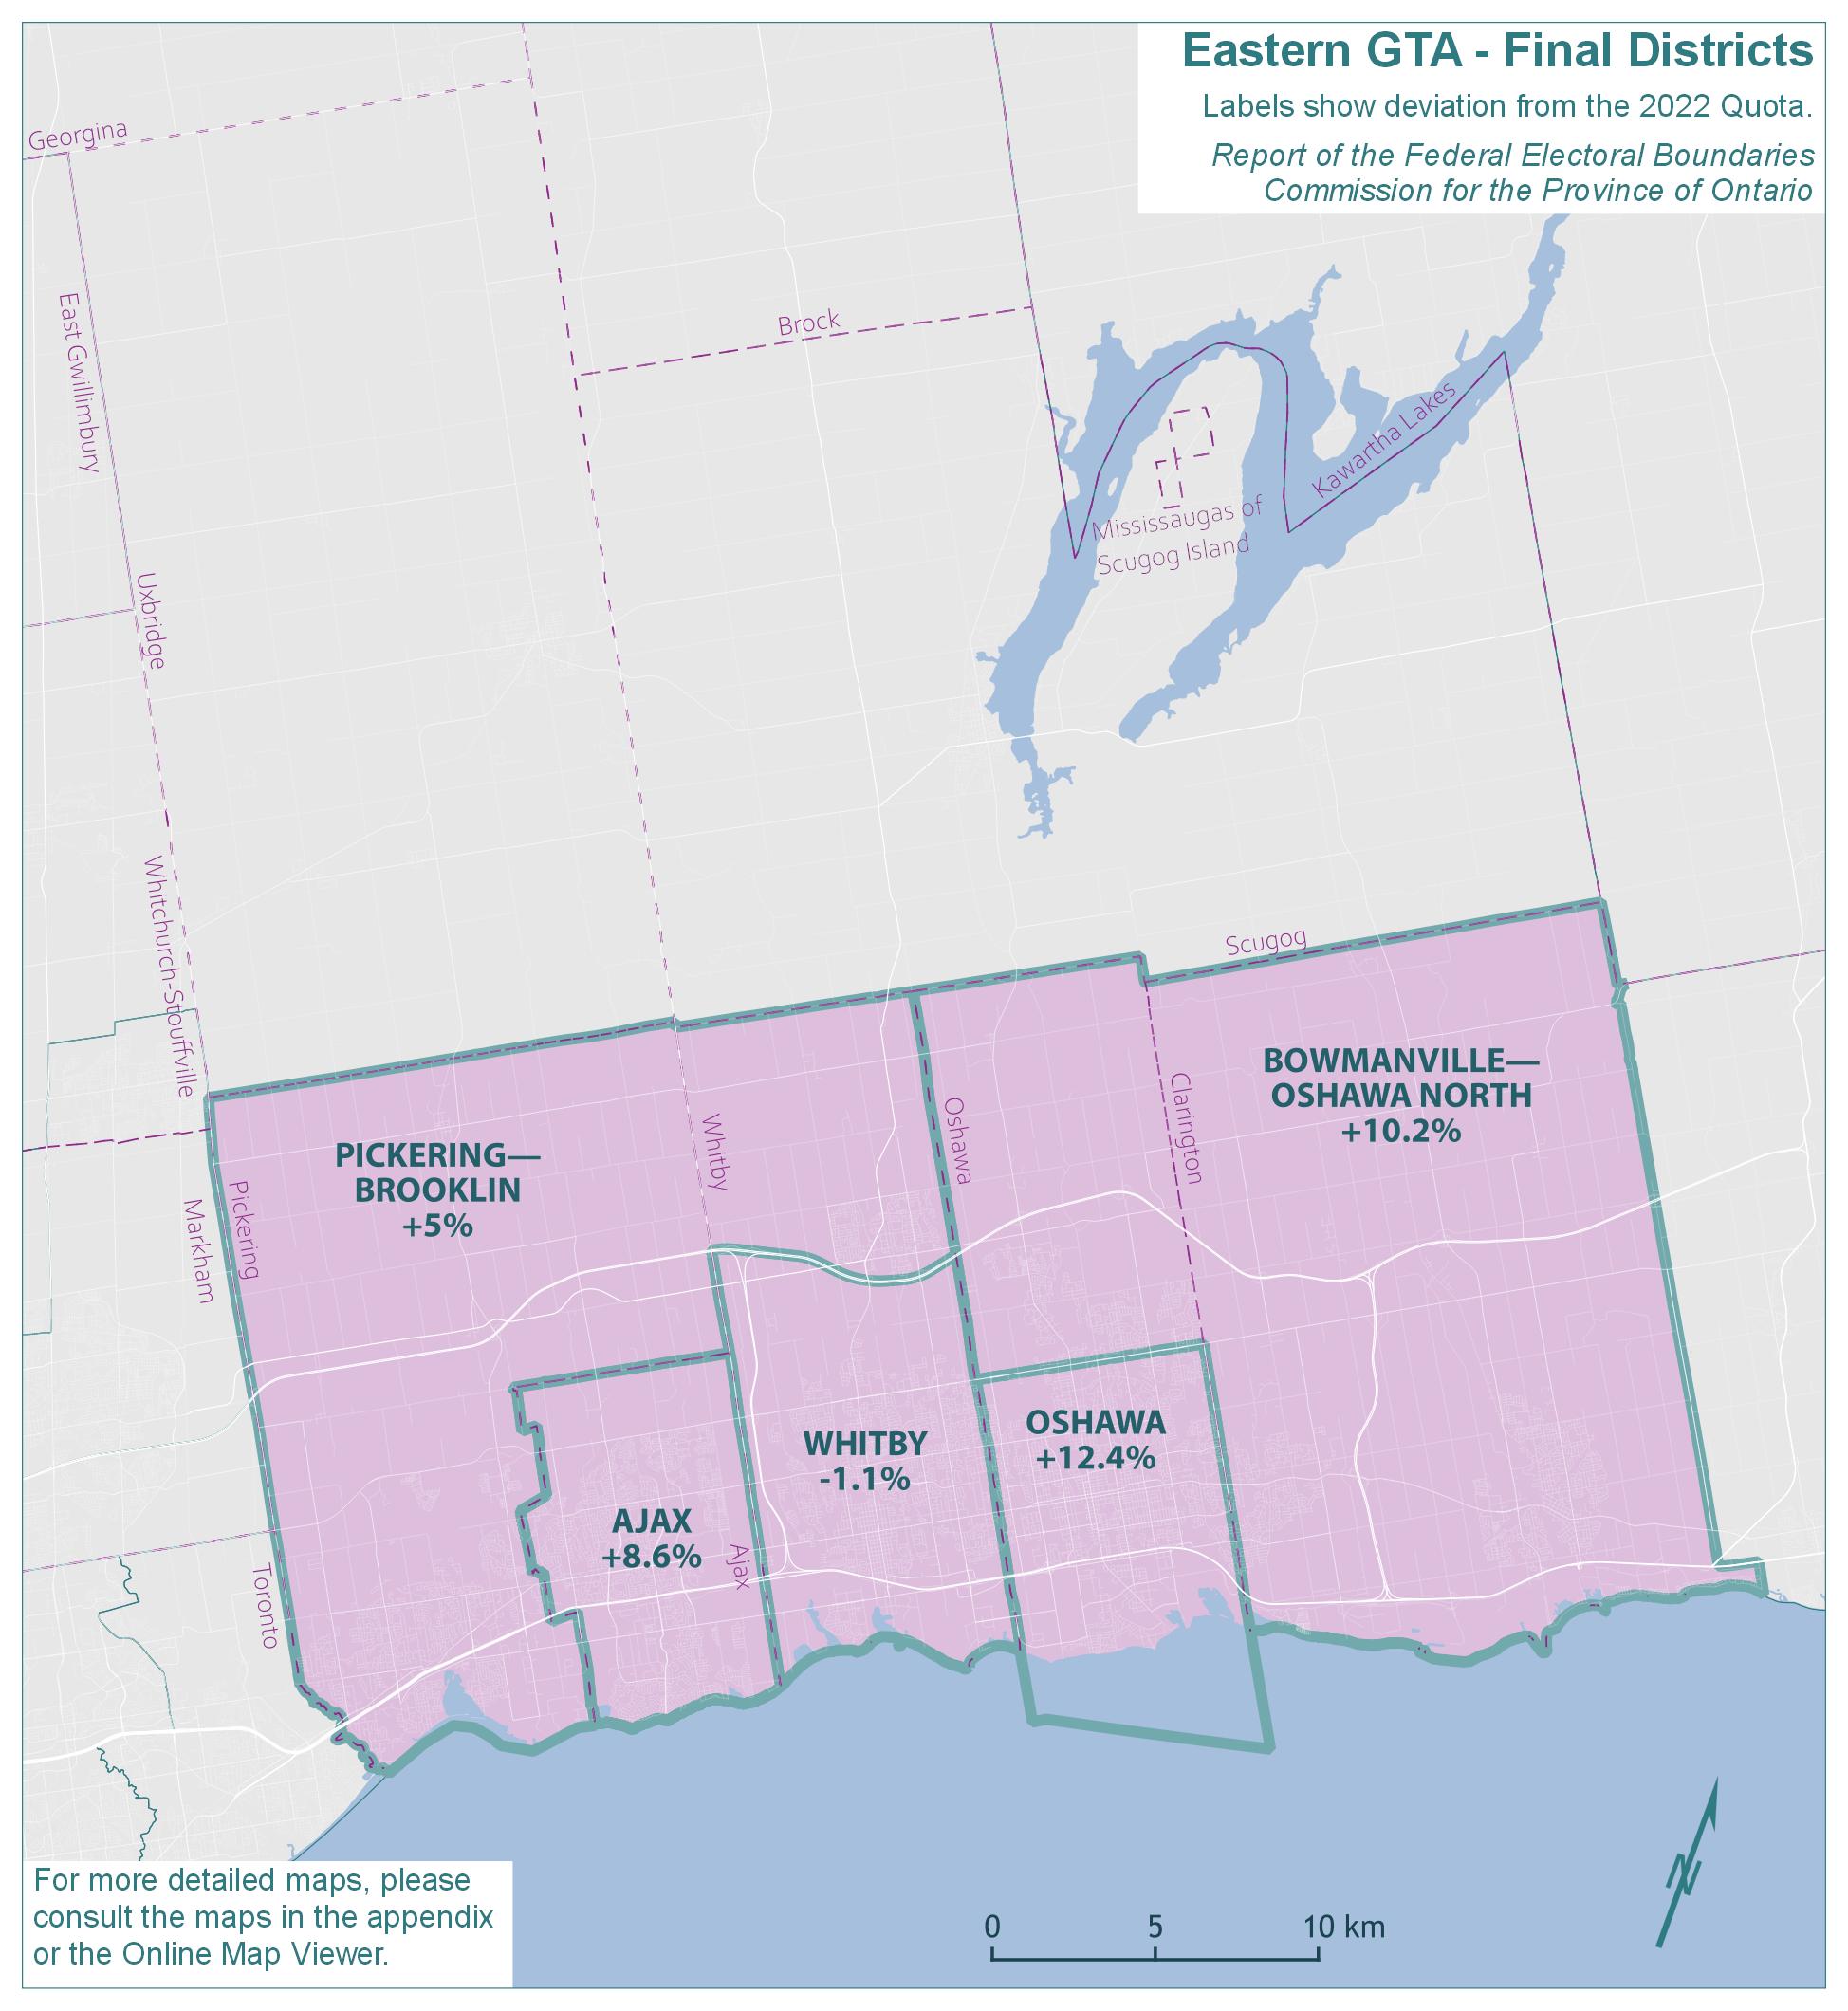
Text version of "Eastern Greater Toronto Area (GTA) - Final Districts"
Labels show deviation from the 2022 Quota.
Report of the Federal Electoral Boundaries Commission for the Province of Ontario
For more detailed maps, please consult the maps in the appendix or the Online Map Viewer.
| Electoral district | Deviation |
|---|---|
| Ajax | 8.6% |
| Bowmanville—Oshawa North | 10.2% |
| Oshawa | 12.4% |
| Pickering—Brooklin | 5% |
| Whitby | -1.1% |
The population of Eastern GTA grew by 14.6%, from 582,132 in 2011 to 667,211 in 2021. The remainder of Ontario grew by 10.5% in the same period.
The existing five electoral districts in Eastern GTA would have an average 2021 population of 133,442 and an average deviation of 14.5% from the Quota. The absolute range between the least and most populous districts would be 25.3 percentage points. The populations and deviations from the Quota for the existing electoral districts are shown in Table 7A.
| Electoral Districts | Population – 2011 | Deviation from Quota – 2012 | Population – 2021 | Deviation from Quota – 2022 |
|---|---|---|---|---|
| Ajax | 109,600 | +3.19% | 126,666 | +8.64% |
| Durham | 115,395 | +8.64% | 150,235 | +28.86% |
| Oshawa | 125,771 | +18.41% | 131,067 | +12.42% |
| Pickering—Uxbridge | 109,344 | +2.95% | 120,742 | +3.56% |
| Whitby | 122,022 | +14.88% | 138,501 | +18.79% |
| Average | 116,426 | +9.61% | 133,442 | +14.45% |
| Range (most populous to least populous) | 16,427 | 15.46 pp | 29,493 | 25.30 pp |
pp = percentage points
In preparing the proposed redistribution plan, the Commission noted that the population growth over the past decade in the Durham Region necessitated a number of significant boundary adjustments in this geographic piece. Most notably, a new district (Lake Simcoe—Uxbridge, renamed York—durham) was created out of the northern portions of Durham Region, combining it with areas in Central Ontario and Northern GTA.
In the proposed redistribution plan, the boundaries of Ajax were unchanged and the Commission proposed more compact districts for Oshawa and Whitby, with populations much closer to the Quota.
The area constituting the southern portion of the current district of Durham was renamed Bowmanville—Oshawa North. The remainder of Durham was placed in the proposed new district of Lake Simcoe—Uxbridge (renamed York—durham), as was discussed in the Central Ontario section.
The proposed district of Lake Simcoe—Uxbridge incorporated the northern portions of the existing districts of Pickering—Uxbridge and Durham. As a result of this change and of population growth in the City of Whitby (and the community of Brooklin in particular), the Commission proposed to place Brooklin in the district of Pickering—Brooklin.
The populations and deviations from the Quota for the proposed districts are shown in Table 7B.
| Electoral Districts | Population – 2021 | Deviation from Quota – 2022 |
|---|---|---|
| Ajax | 126,666 | +8.64% |
| Bowmanville—Oshawa North | 123,036 | +5.53% |
| Oshawa | 126,499 | +8.50% |
| Pickering—Brooklin | 122,430 | +5.01% |
| Whitby | 120,078 | +2.99% |
| Average | 123,742 | +6.13% |
| Range (most populous to least populous) | 6,588 | 5.65 pp |
pp = percentage points
Some aspects of the Commission's proposed redistribution plan received positive comments, other areas received criticism. Several boundary changes were made as a result of the public submissions.
The Commission appreciated the submission from the Town of Ajax supporting the Commission's proposal to leave the Ajax district unchanged. Ajax will continue to remain unchanged in the final boundaries.
In a number of submissions made in response to the proposed plan, including from the City of Whitby and the Chamber of Commerce, the need to rebalance
Whitby was acknowledged. Some indicated that it was appropriate to separate Brooklin which, it was asserted, had its own history and was separated geographically from Whitby. However, the community of Brooklin, supported by the Town of Whitby, suggested that Brooklin should not become part of the Pickering district and should remain with Whitby, or at a minimum, be placed with Northern Oshawa.
The Commission concluded that this request could not be implemented. In 2012, the previous commission had proposed that Brooklin could no longer be aligned with Whitby, but this change was not ultimately made. Ten years later it is more apparent that Brooklin cannot remain in the same district as Whitby if the principle of voting parity is respected.
Various alternative maps were examined and experimented with by the Commission (including some maps submitted by members of the public). The Commission has decided on this final configuration because this map does a better job of limiting municipal splits and also separates the urban and suburban municipalities along Highways 401 and 407 from the rural municipalities to the north.
The fact that the Commission's proposal split the City of Oshawa into four districts was a point of concern for a number of parties. The final Oshawa district boundaries now mirror the existing boundaries. The resulting deviations from Quota exceed what the Commission had endeavoured to achieve; however, the Commission concluded it was reasonable to divide Oshawa into only two districts thus reducing the risk of diminishing the City's effective representation throughout four districts. The Commission also sees the value in retaining the historical pattern of the electoral district.
Bowmanville—Oshawa North has also been changed in order to reduce municipal splits. The western and northern boundary has been moved to Oshawa and Clarington's municipal limits. As discussed above in relation to the geographic piece of Central East Ontario, the Commission did receive submissions on the east-west split of Clarington. Some submissions argued that it was preferable to place the municipality into a single district, while others argued that the more rural eastern half of the municipality was better off with Northumberland—Clarke. The Commission has opted to maintain this split, as it was in the existing and proposed districts.
The boundaries for Whitby have been simplified, as described above. The final district of Whitby will constitute the Town of Whitby south of Highway 407.
The names, populations and deviations from the Quota for Eastern GTA's final districts are shown in Table 7C.
| Electoral Districts | Population – 2021 | Deviation from Quota – 2022 |
|---|---|---|
| Ajax | 126,666 | +8.64% |
| Bowmanville—Oshawa North | 128,534 | +10.24% |
| Oshawa | 131,067 | +12.42% |
| Pickering—Brooklin | 122,430 | +5.01% |
| Whitby | 115,257 | -1.14% |
| Average | 124,791 | +7.03% |
| Range (most populous to least populous) | 15,810 | 13.56 pp |
pp = percentage points
Northern Greater Toronto Area (GTA)
Northern Greater Toronto Area (GTA) - Existing Districts
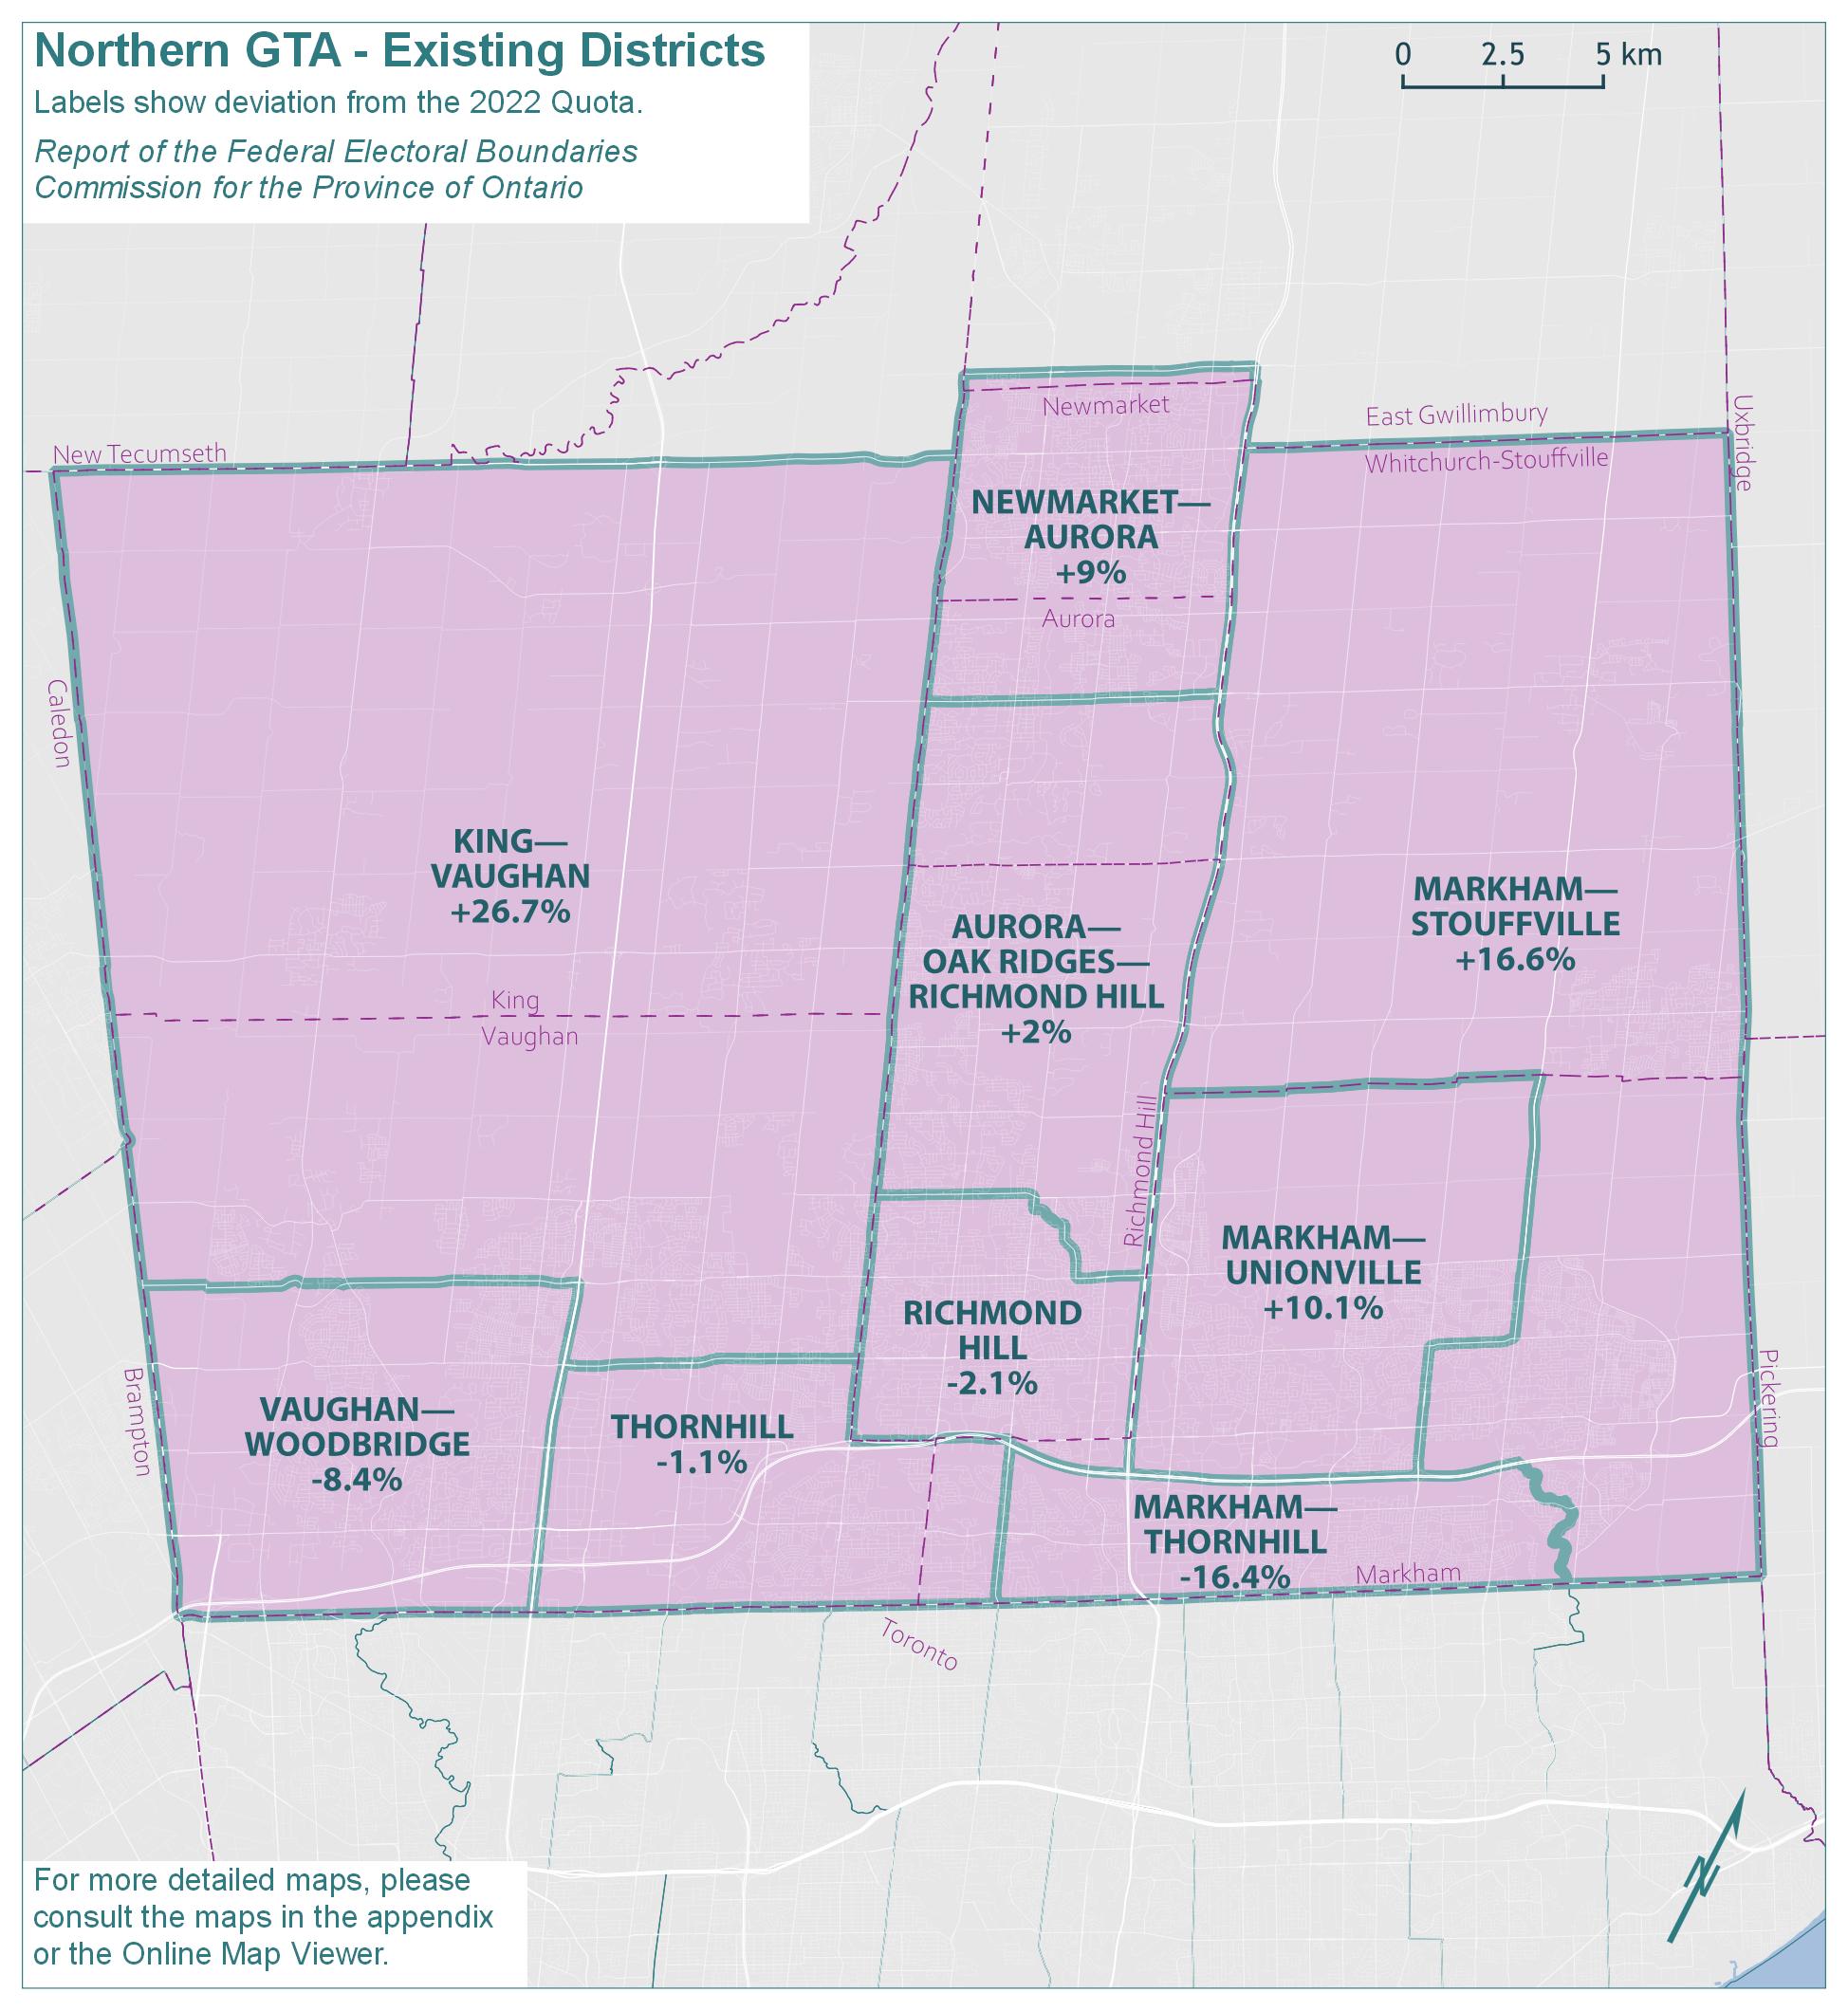
Text version of "Northern Greater Toronto Area (GTA) - Existing Districts"
Labels show deviation from the 2022 Quota.
Report of the Federal Electoral Boundaries Commission for the Province of Ontario
For more detailed maps, please consult the maps in the appendix or the Online Map Viewer.
| Electoral district | Deviation |
|---|---|
| Aurora—Oak Ridges—Richmond Hill | 2.0% |
| King—Vaughan | 26.7% |
| Markham—Stouffville | 16.6% |
| Markham—Thornhill | -16.4% |
| Markham—Unionville | 10.1% |
| Newmarket—Aurora | 9.0% |
| Richmond Hill | -2.1% |
| Thornhill | -1.1% |
| Vaughan—Woodbridge | -8.4% |
Northern Greater Toronto Area (GTA) - Proposed Districts
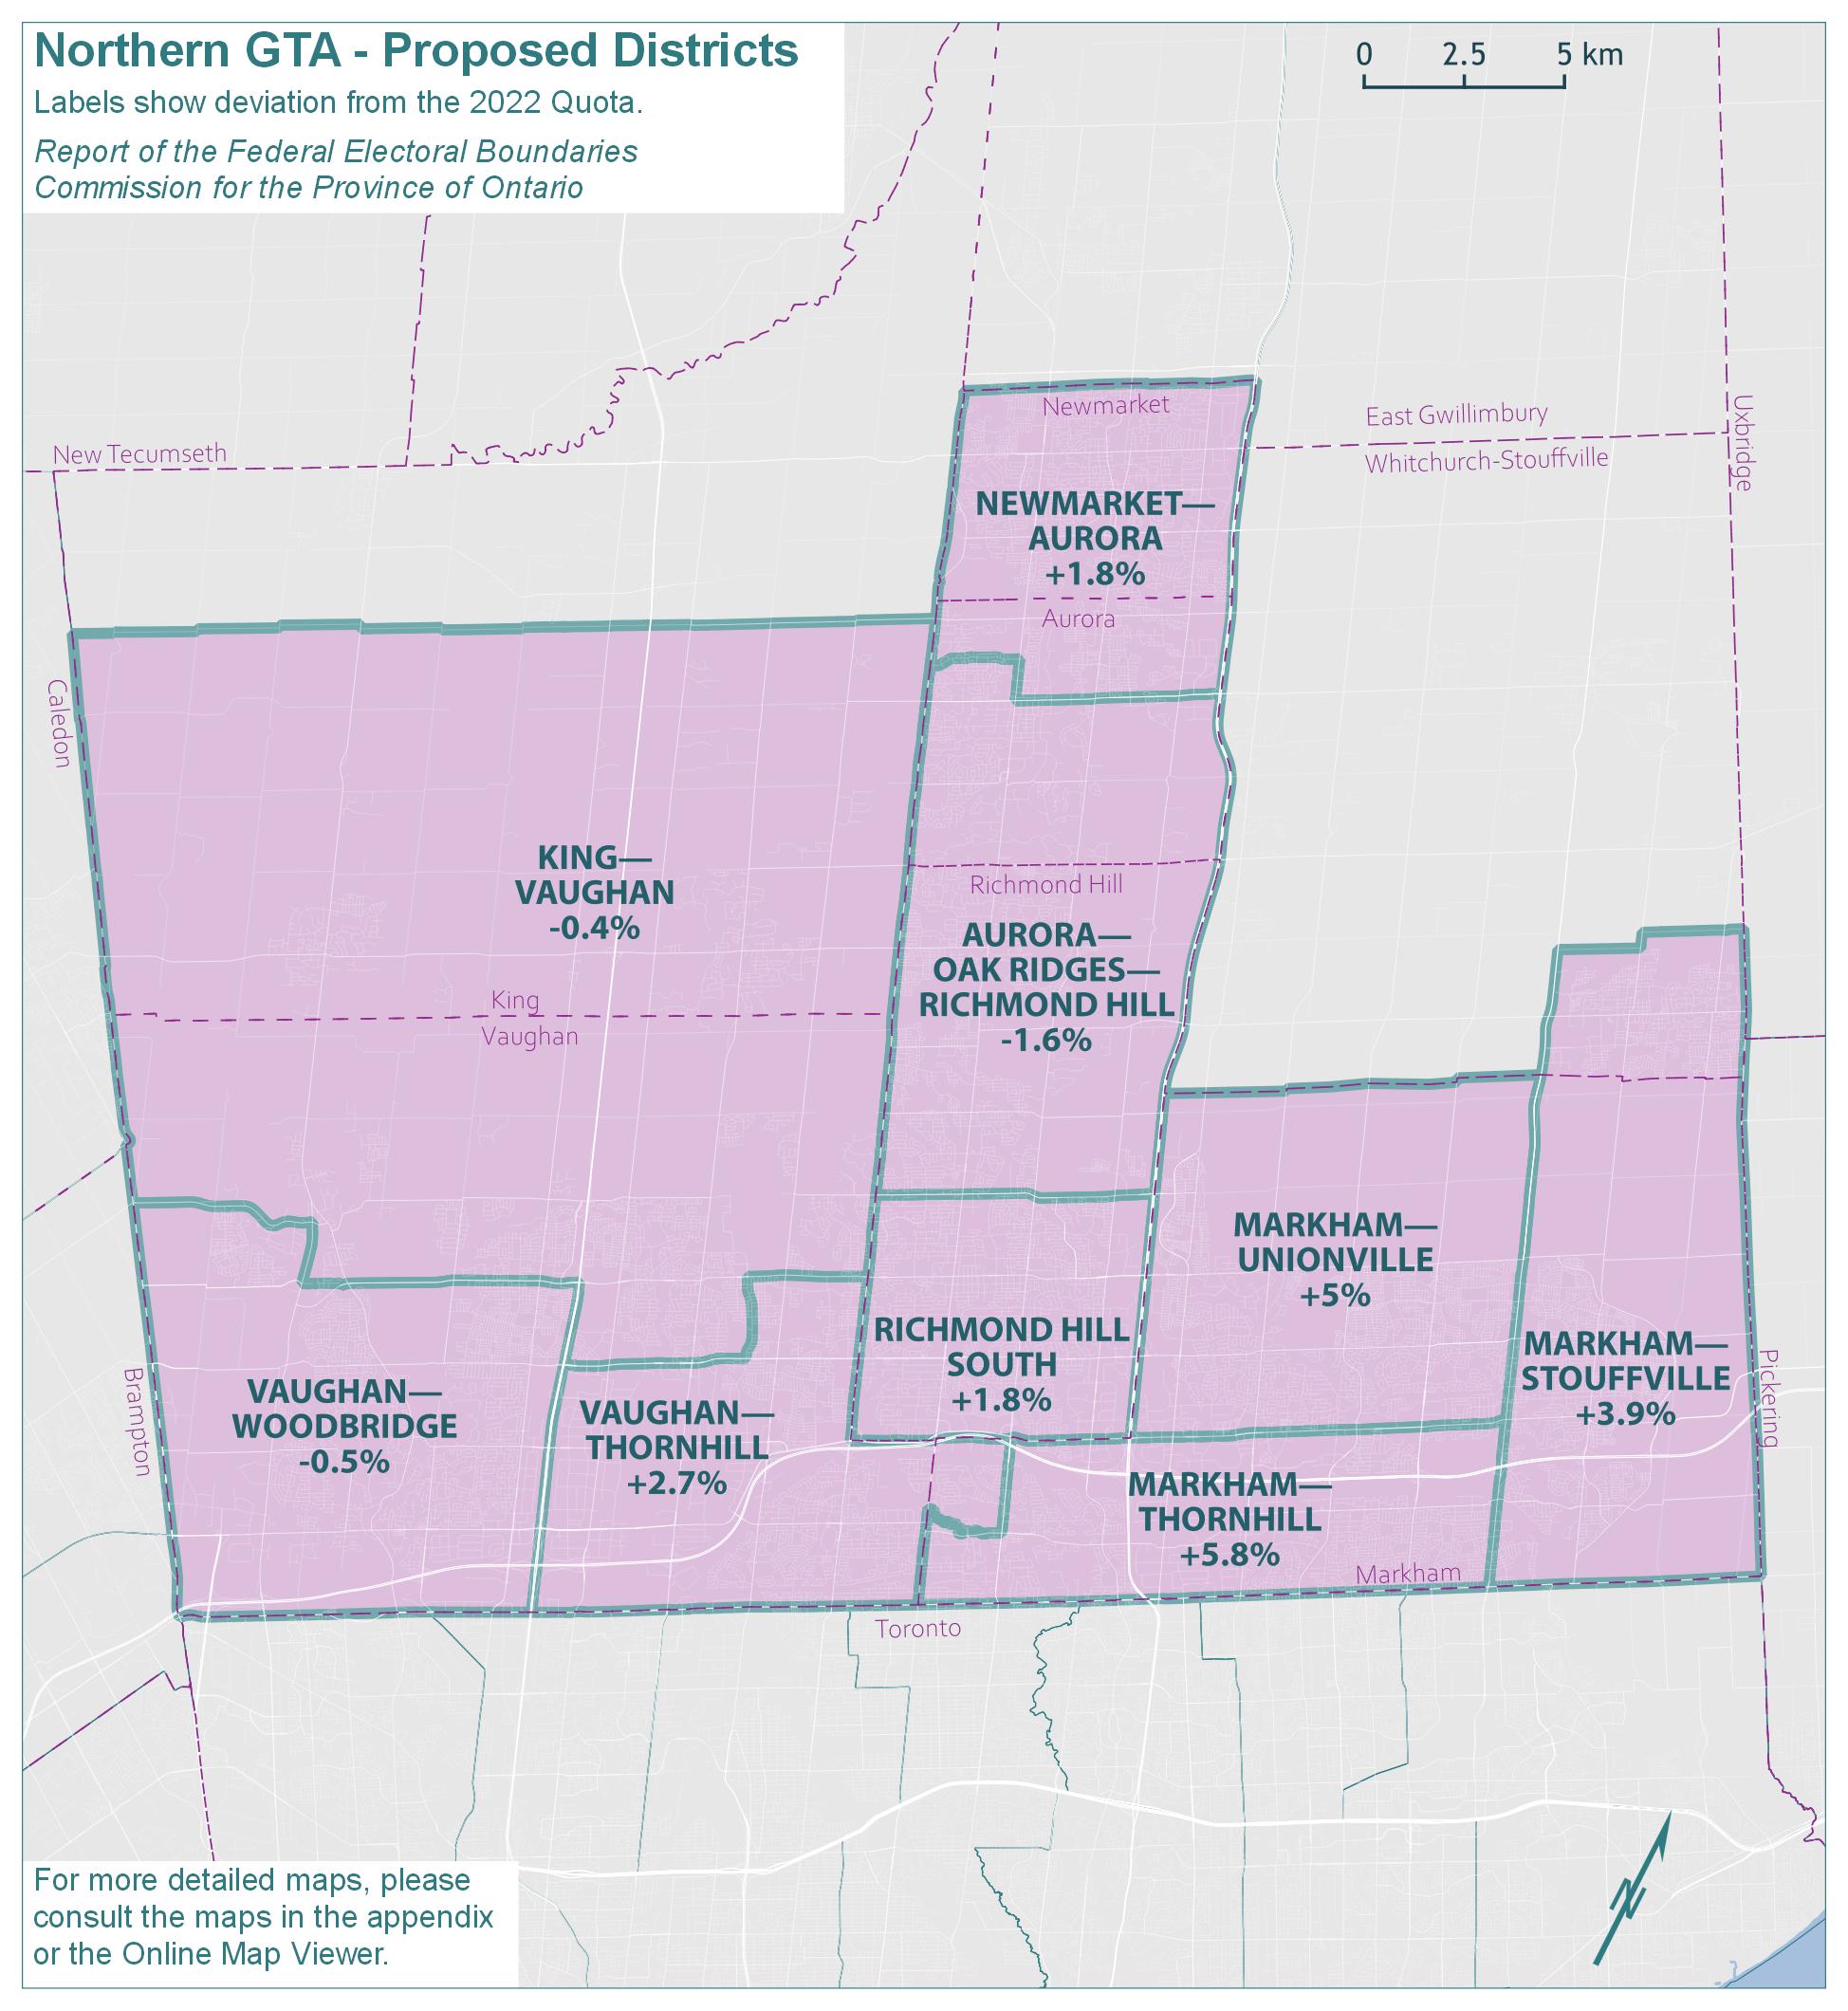
Text version of "Northern Greater Toronto Area (GTA) - Proposed Districts"
Labels show deviation from the 2022 Quota.
Report of the Federal Electoral Boundaries Commission for the Province of Ontario
For more detailed maps, please consult the maps in the appendix or the Online Map Viewer.
| Electoral district | Deviation |
|---|---|
| Aurora—Oak Ridges—Richmond Hill | -1.6% |
| King—Vaughan | -0.4% |
| Markham—Stouffville | 3.9% |
| Markham—Thornhill | 5.8% |
| Markham—Unionville | 5.0% |
| Newmarket—Aurora | 1.8% |
| Richmond Hill South | 1.8% |
| Vaughan—Thornhill | 2.7% |
| Vaughan—Woodbridge | -0.5% |
Northern Greater Toronto Area (GTA) - Final Districts
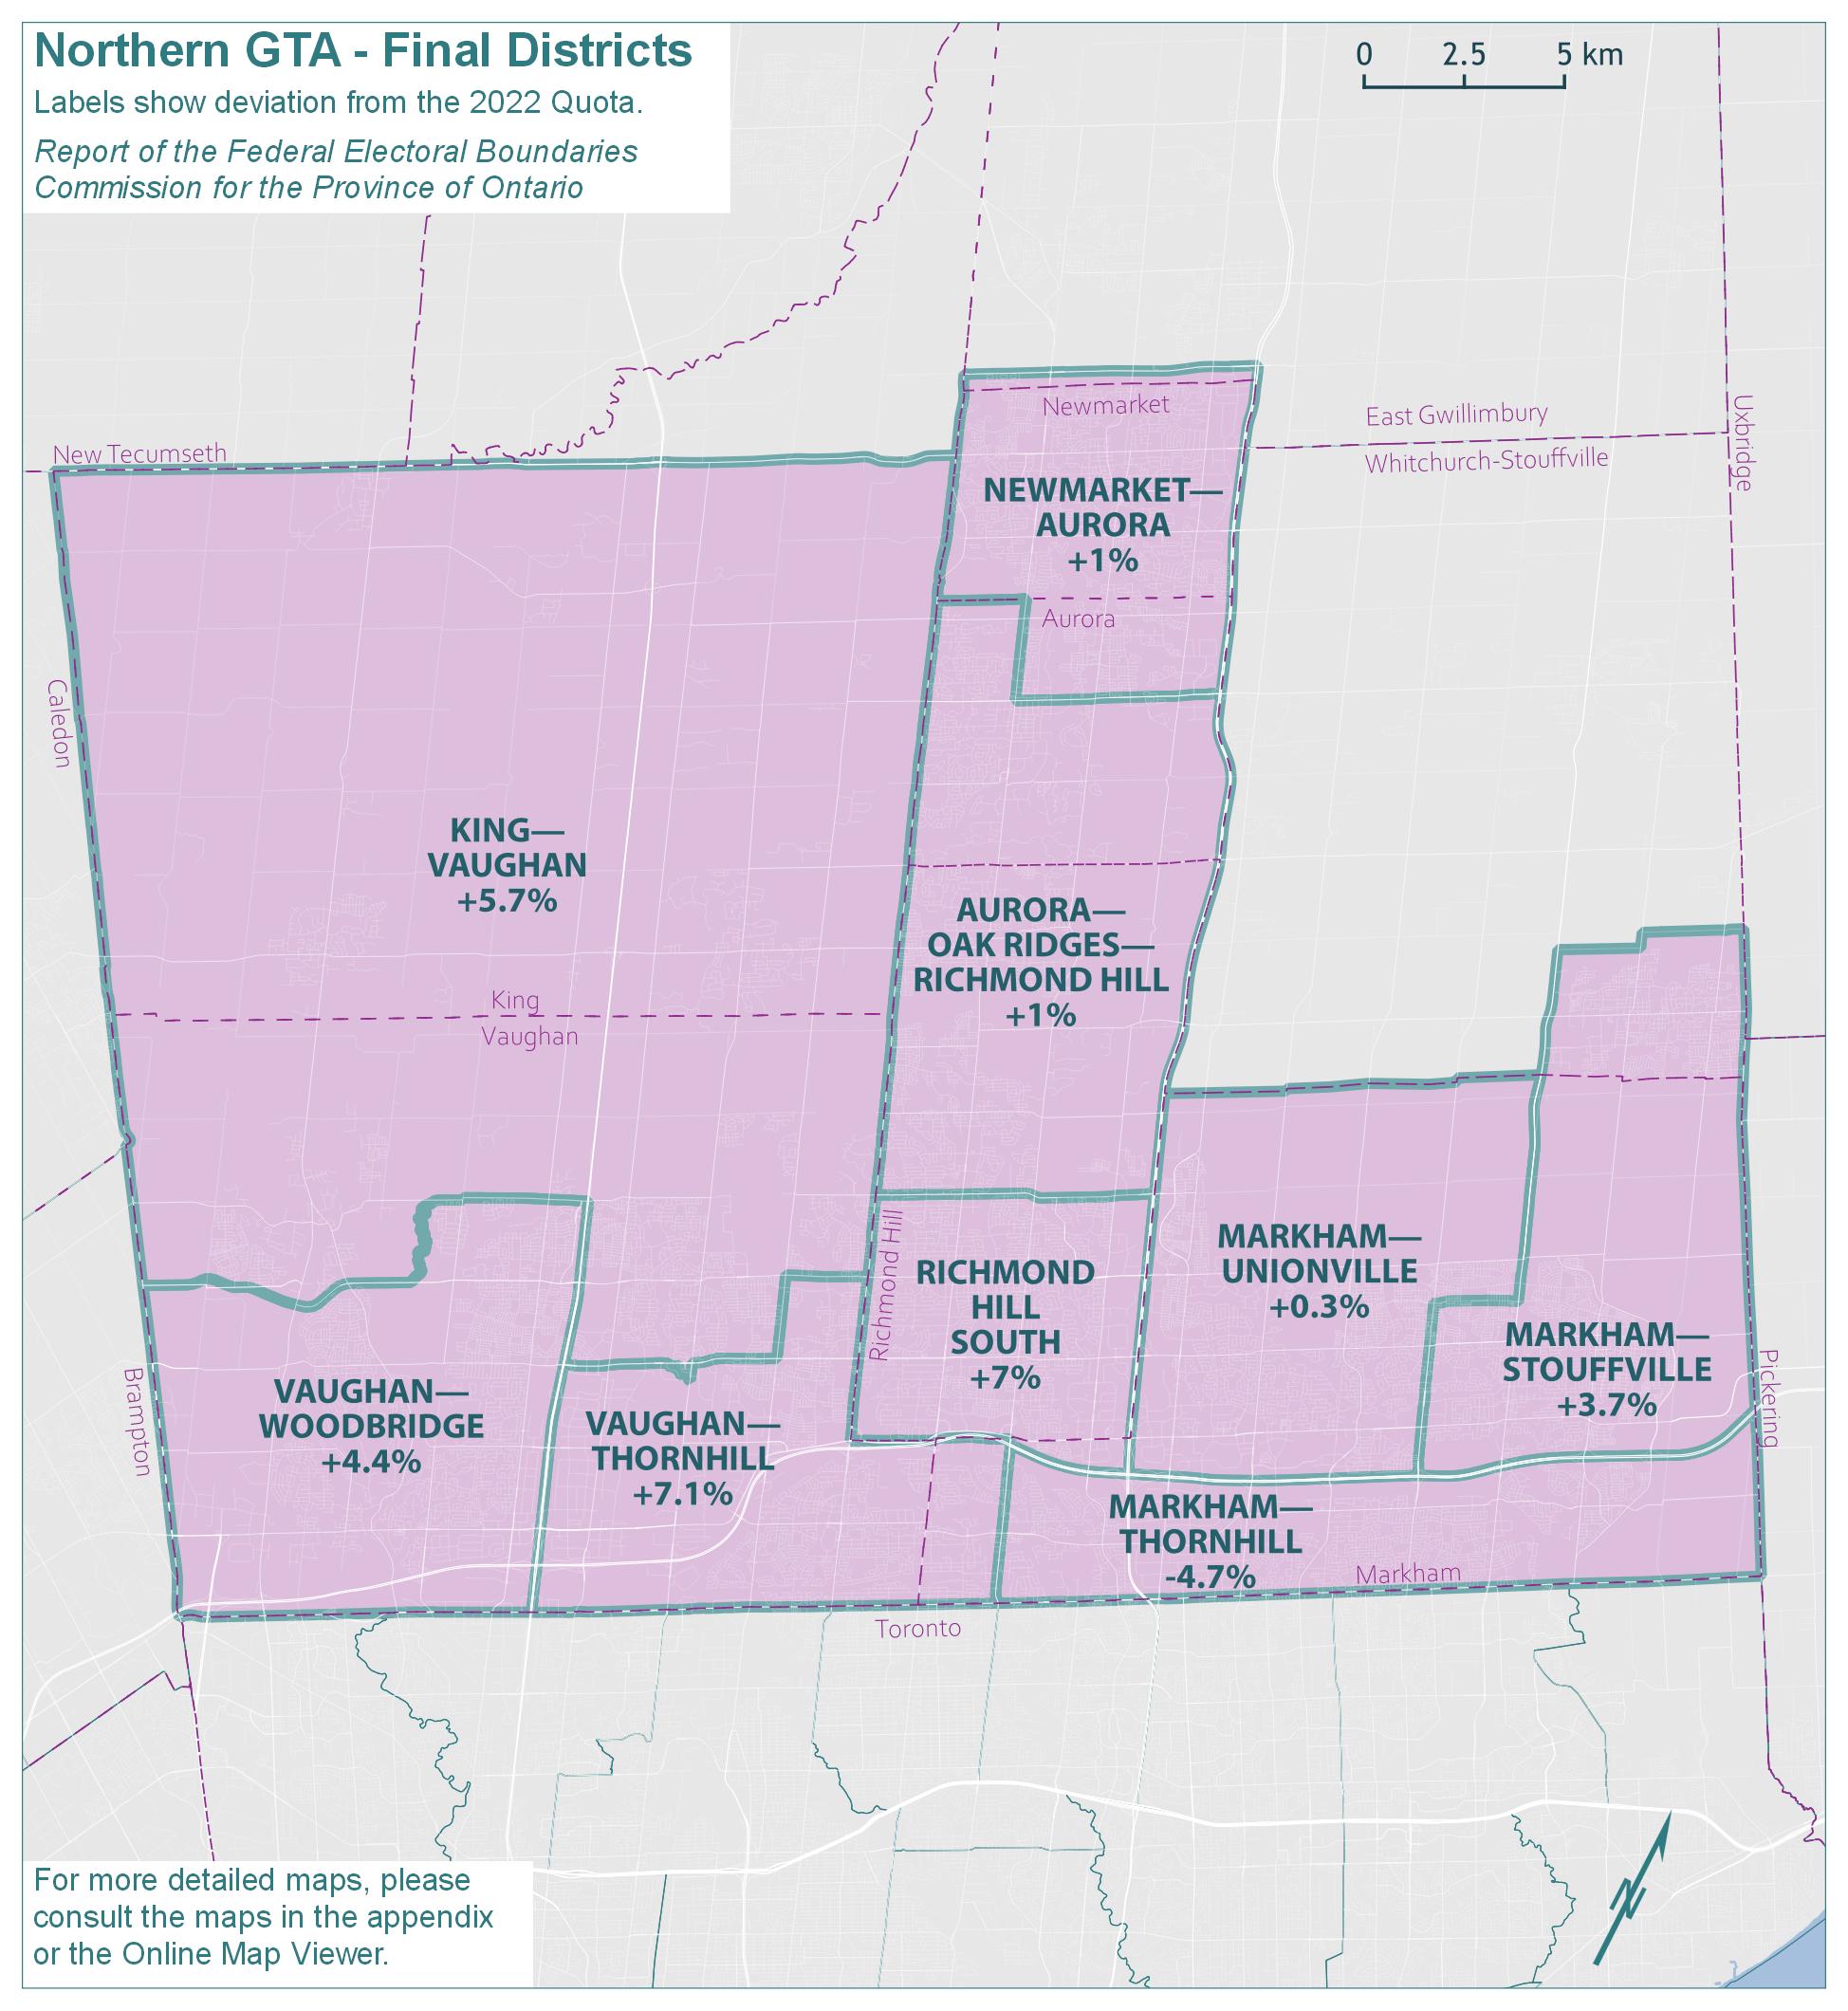
Text version of "Northern Greater Toronto Area (GTA) - Final Districts"
Labels show deviation from the 2022 Quota.
Report of the Federal Electoral Boundaries Commission for the Province of Ontario
For more detailed maps, please consult the maps in the appendix or the Online Map Viewer.
| Electoral district | Deviation |
|---|---|
| Aurora—Oak Ridges—Richmond Hill | 1% |
| King—Vaughan | 5.7% |
| Markham—Stouffville | 3.7% |
| Markham—Thornhill | -4.7% |
| Markham—Unionville | 0.3% |
| Newmarket—Aurora | 1% |
| Richmond Hill South | 7% |
| Vaughan—Thornhill | 7.1% |
| Vaughan—Woodbridge | 4.4% |
The population of Northern GTA grew by 13%, from 965,985 in 2011 to 1,091,756 in 2021. The remainder of Ontario grew by 10.5% in the same period.
The existing nine electoral districts in Northern GTA would have an average 2021 population of 121,306 and an average deviation of 4% from the Quota. The range between the least and most populous districts would be 43.1 percentage points. As shown in Table 8A below, there are wide population disparities among the electoral districts within this geographic piece.
| Electoral Districts | Population – 2011 | Deviation from Quota – 2012 | Population – 2021 | Deviation from Quota – 2022 |
|---|---|---|---|---|
| Aurora—Oak Ridges—Richmond Hill | 106,064 | -0.14% | 118,883 | +1.97% |
| King—Vaughan | 109,235 | +2.84% | 147,695 | +26.68% |
| Markham—Stouffville | 109,780 | +3.36% | 135,944 | +16.60% |
| Markham—Thornhill | 102,221 | -3.76% | 97,510 | -16.37% |
| Markham—Unionville | 104,693 | -1.43% | 128,308 | +10.05% |
| Newmarket—Aurora | 109,457 | +3.05% | 127,134 | +9.04% |
| Richmond Hill | 108,658 | +2.30% | 114,180 | -2.07% |
| Thornhill | 110,427 | +3.97% | 115,292 | -1.11% |
| Vaughan—Woodbridge | 105,450 | -0.72% | 106,810 | -8.39% |
| Average | 107,332 | +1.05% | 121,306 | +4.04% |
| Range (most populous to least populous) | 8,206 | 7.73 pp | 50,185 | 43.05 pp |
pp = percentage points
In its proposed redistribution plan, the Commission noted that significant changes were required to ensure voter parity as much as reasonably possible. Notably, a new district of Lake Simcoe—Uxbridge (renamed York—durham) was created out of portions of Markham—Stouffville combined with areas in Eastern GTA and Central Ontario. This allowed the Commission to shift the remaining boundaries in order to achieve population parity. The proposed populations and deviations from the Quota are shown in Table 8B.
| Electoral Districts | Population – 2021 | Deviation from Quota – 2022 |
|---|---|---|
| Aurora—Oak Ridges—Richmond Hill | 114,676 | -1.64% |
| King—Vaughan | 116,118 | -0.40% |
| Markham—Stouffville | 121,176 | +3.93% |
| Markham—Thornhill | 123,400 | +5.84% |
| Markham—Unionville | 122,401 | +4.98% |
| Newmarket—Aurora | 118,666 | +1.78% |
| Richmond Hill South | 118,679 | +1.79% |
| Vaughan—Thornhill | 119,771 | +2.73% |
| Vaughan—Woodbridge | 115,957 | -0.54% |
| Average | 118,983 | +2.05% |
| Range (most populous to least populous) | 8,724 | 7.48 pp |
pp = percentage points
The Commission received many submissions with respect to boundary changes in this geographic piece.
In Markham, there were many submissions pertaining to the proposed boundaries on Highway 7, Markham Road, and Main Street North. Many submitters suggested that the establishments and amenities along these streets are important community gathering spots and, as such, these streets make poor boundaries. Given other changes, the Commission noted that reasonable population equality could be achieved by moving boundaries back to Highway 407 and McCowan Road. Final districts reflect this change.
The Commission learned that the proposed boundary for Markham—Stouffville would cut Markham Village in two and would also cut off the community of Raymerville-Markville East, which is connected to Markham Village. It was asserted that splitting this community of interest would disrupt existing relationships, weaken Markham Village's voice and could potentially play a role in diminishing the community's unique identity.
The Commission was asked to preserve the existing boundary of Markham—Stouffville to protect the asserted community of interest of Markham Village and Raymerville-Markville East, which does not have a significant impact on voter parity. The Commission found these arguments persuasive and maintained the boundary of Markham—Stouffville along McCowan Road in the west and Highway 407 in the south. However, the boundary on 16th Avenue has been shifted north to Bur Oak Avenue.
As such, Markham—Unionville has largely been returned to its existing boundaries, with the boundary transfer from 16th Avenue to Bur Oak Avenue being the only exception.
Markham—Thornhill's eastern boundary has been shifted eastward to the municipal limit in response to submissions commenting that the proposed boundary on Markham Road was inappropriate because it cuts off the Cedarwood and the Rouge River neighbourhoods.
There were also several differing suggestions as to where to place the boundary between Markham—Thornhill and Vaughan—Thornhill, with suggestions ranging from Yonge Street to Highway 404. The Commission decided to restore this boundary to its previous location on Bayview Avenue.
There were also submissions that Dufferin Street rather than Peter Rupert Avenue, a residential street, be used to define the boundary between Vaughan—Thornhill and King—Vaughan. In the interests of not splitting up neighbourhoods, the Commission has acceded to this request.
The Commission has also shifted a small section of the boundary between these two districts southward in order to transfer the Sherwood Park neighbourhood into King—Vaughan. This area had previously been in Vaughan—Thornhill, but submitters told the Commission that this was a poor alignment because residents were cut off from the remainder of the district by an industrial zone.
With respect to King—Vaughan, the Commission agreed with submissions to move the northerly boundary to Highway 9 and Davis Drive. This keeps King Township whole except for the portion north of Highway 9 and Davis Drive which is close to the community of Bradford.
The Commission also received submissions opposing how the proposed boundaries had divided the community of Kleinburg in two. The Commission agreed with the suggestion to keep the community whole in the riding of King—Vaughan. This submission was implemented by moving the boundary in the southwest to follow Major MacKenzie Drive. This also shifts the neighbourhood of Park Ridge into King—Vaughan, which was requested by submitters.
To offset the population change caused by unifying the community of Kleinburg, the Commission opted to move the boundary between King—Vaughan and Vaughan—Woodbridge to Teston Road and close to Pine Valley Drive. It was suggested to the Commission that it was appropriate to include the Vellore Village neighbourhood in Vaughan—Woodbridge with which it has a strong association and connection. The new boundary follows the City of Vaughan's Ward 3 with one exception. The western boundary was moved westward to the creek in order to avoid splitting the new developments along Pine Valley Drive.
The boundary for Aurora—Oak Ridges—Richmond Hill west of Yonge Street was moved northward in part to align with the Aurora-Newmarket municipal boundary.
While it was reported to the Commission that it had been hoped that Town of Aurora could remain whole as a distinct urban community, if that could not be accomplished, the transition of the very northwest corner of Aurora into the district of Aurora—Oak Ridges—Richmond Hill was supported.
The Commission also moved the proposed northern boundary of Newmarket—Aurora to Green Lane to place the Harvest Hills community with Newmarket, as was asked by multiple submitters. This matches the existing boundary.
Richmond Hill South has received one small change to the proposed boundaries. The southern boundary has been returned to the existing boundary on Highway 407. This is part of the general plan of using Highway 407 instead of Highway 7 as the boundary throughout this geographic piece, as was suggested by several submitters.
Overall, most of the revisions requested in this geographic piece could be made without unreasonably infringing on voter parity.
The names, populations and deviations from the Quota for Northern GTA's final districts are shown in Table 8C.
| Electoral Districts | Population – 2021 | Deviation from Quota – 2022 |
|---|---|---|
| Aurora—Oak Ridges—Richmond Hill | 117,750 | +0.99% |
| King—Vaughan | 123,226 | +5.69% |
| Markham—Stouffville | 120,845 | +3.65% |
| Markham—Thornhill | 111,087 | -4.72% |
| Markham—Unionville | 116,972 | +0.33% |
| Newmarket—Aurora | 117,699 | +0.95% |
| Richmond Hill South | 124,748 | +7.00% |
| Vaughan—Thornhill | 124,866 | +7.10% |
| Vaughan—Woodbridge | 121,705 | +4.39% |
| Average | 119,878 | +2.82% |
| Range (most populous to least populous) | 13,779 | 11.82 pp |
pp = percentage points
Mississauga
Mississauga - Existing Districts
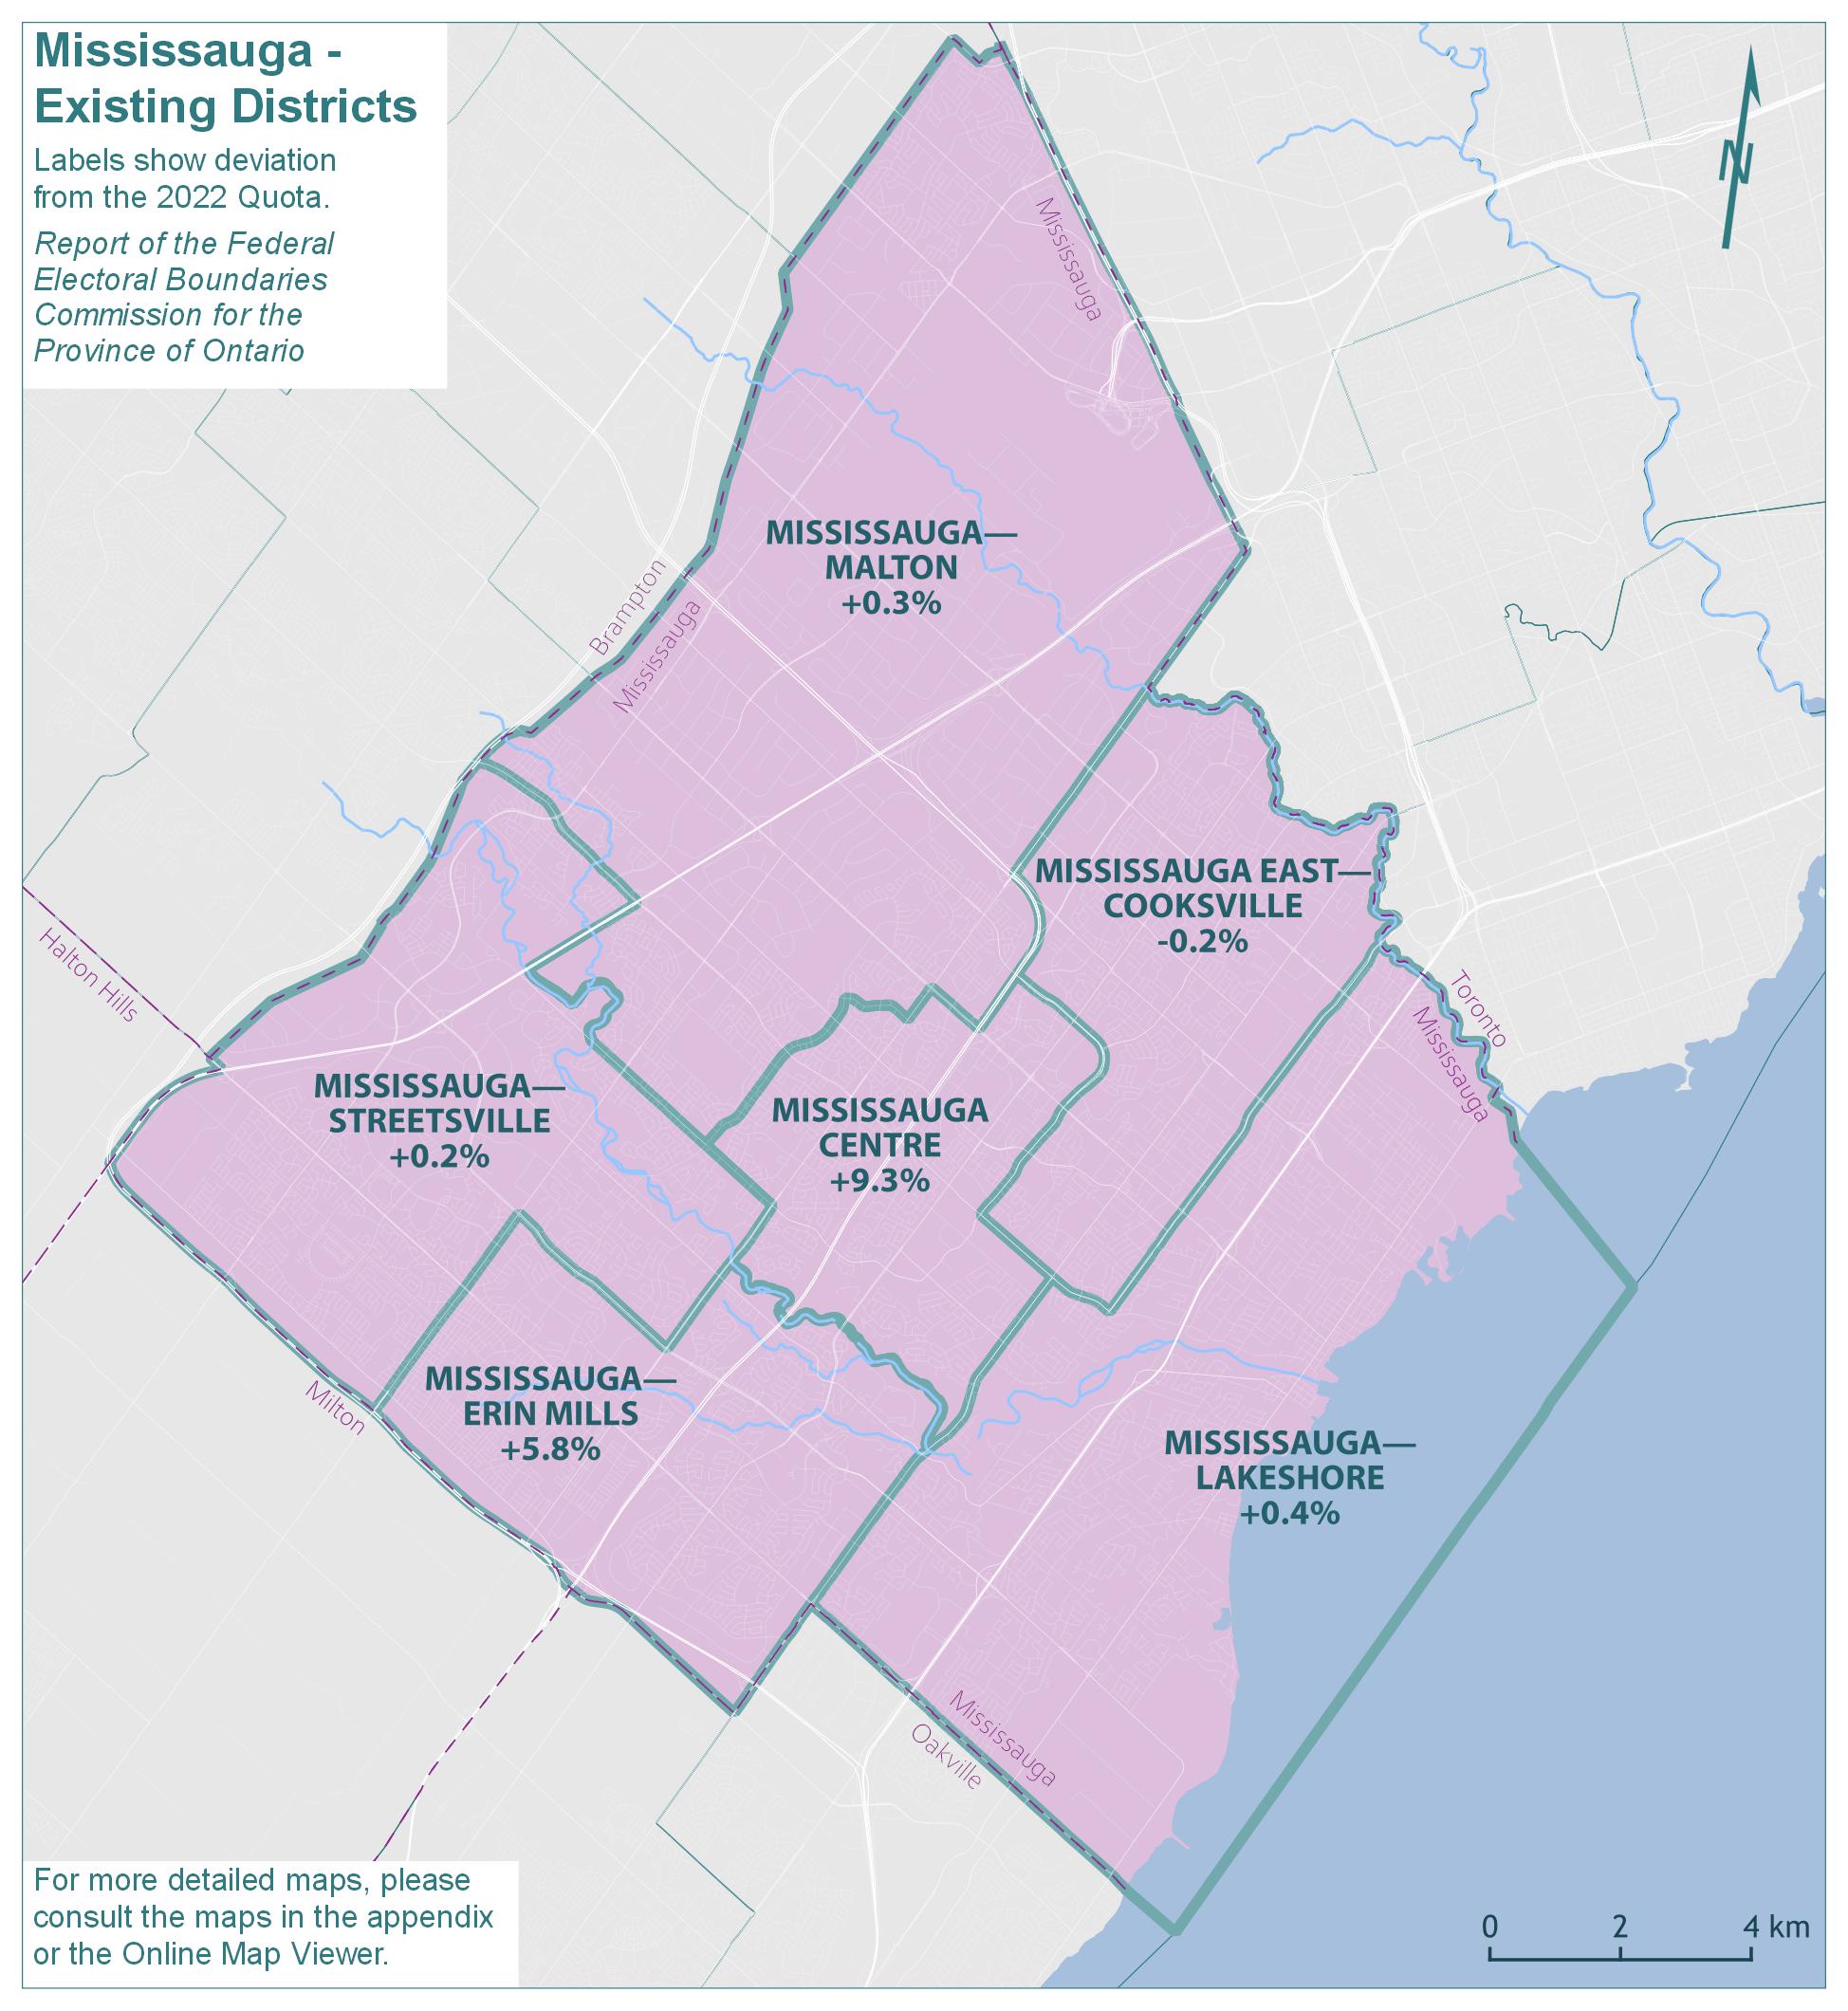
Text version of "Mississauga - Existing Districts"
Labels show deviation from the 2022 Quota.
Report of the Federal Electoral Boundaries Commission for the Province of Ontario
For more detailed maps, please consult the maps in the appendix or the Online Map Viewer.
| Electoral district | Deviation |
|---|---|
| Mississauga Centre | 9.3% |
| Mississauga East—Cooksville | -0.2% |
| Mississauga—Erin Mills | 5.8% |
| Mississauga—Lakeshore | 0.4% |
| Mississauga—Malton | 0.3% |
| Mississauga—Streetsville | 0.2% |
Mississauga - Proposed Districts
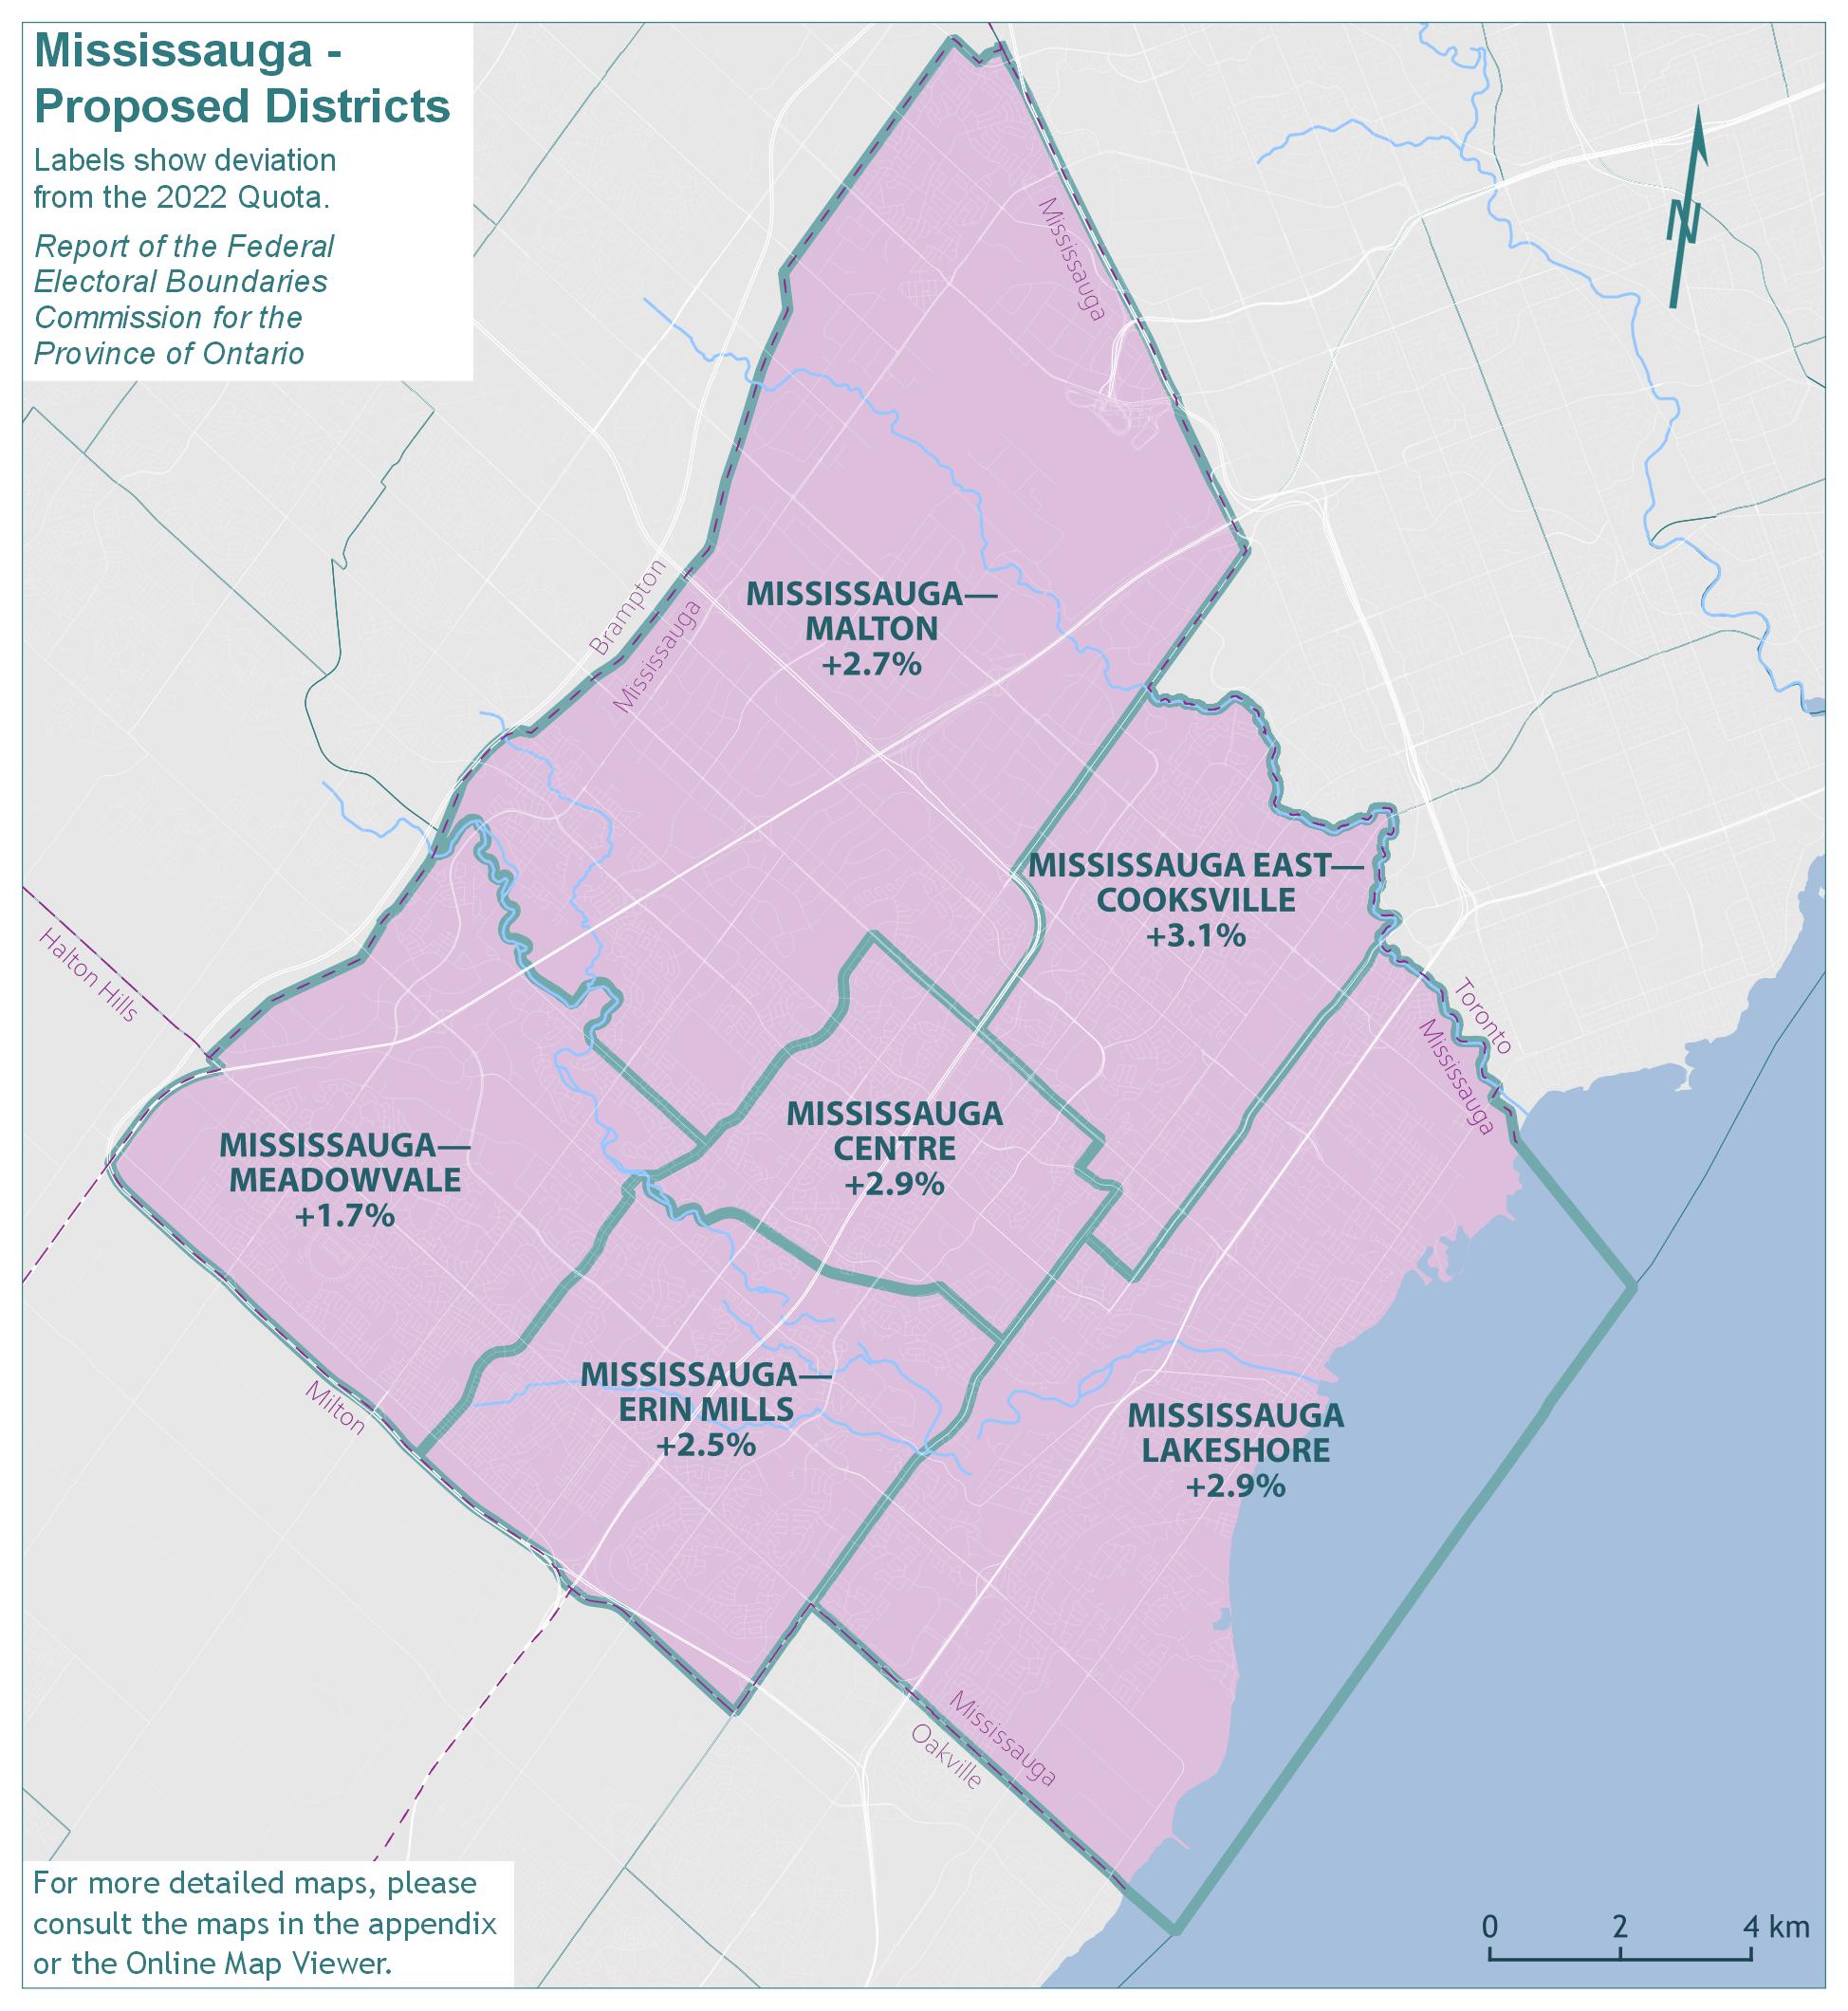
Text version of "Mississauga - Proposed Districts"
Labels show deviation from the 2022 Quota.
Report of the Federal Electoral Boundaries Commission for the Province of Ontario
For more detailed maps, please consult the maps in the appendix or the Online Map Viewer.
| Electoral district | Deviation |
|---|---|
| Mississauga Centre | 2.9% |
| Mississauga—Erin Mills | 2.5% |
| Mississauga East—Cooksville | 3.1% |
| Mississauga Lakeshore | 2.9% |
| Mississauga—Malton | 2.7% |
| Mississauga—Meadowvale | 1.7% |
Mississauga - Final Districts
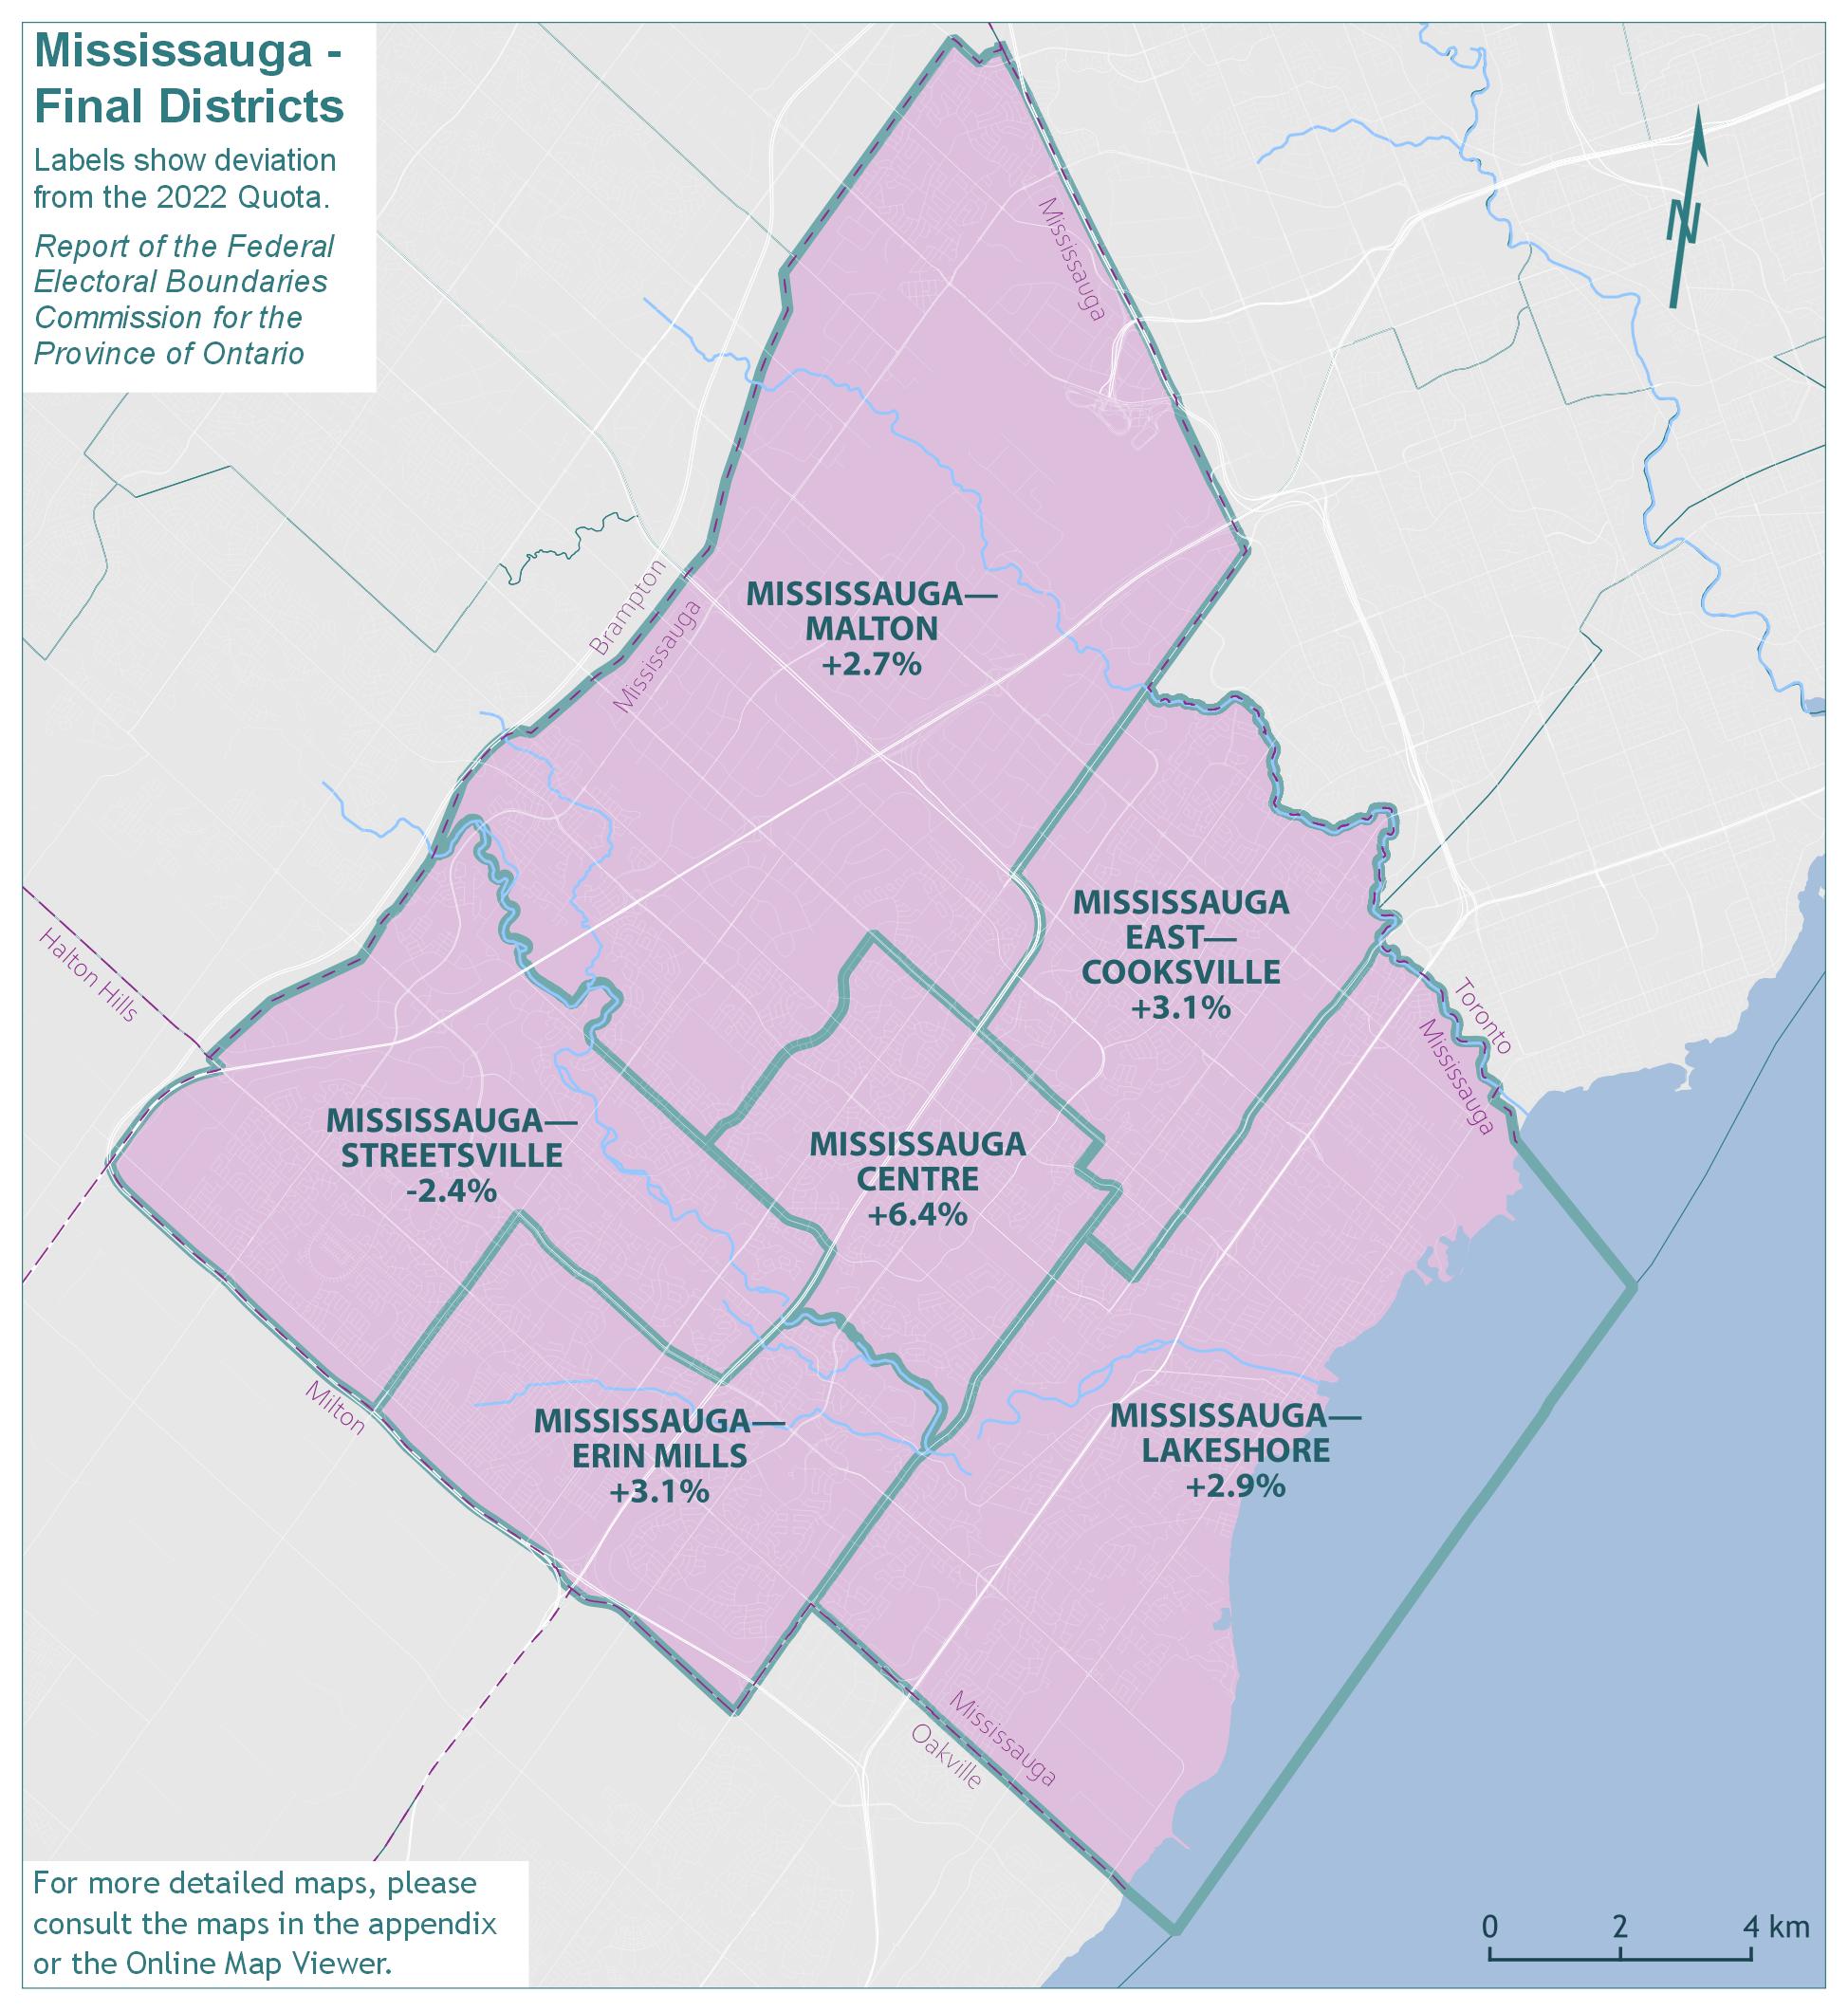
Text version of "Mississauga - Final Districts"
Labels show deviation from the 2022 Quota.
Report of the Federal Electoral Boundaries Commission for the Province of Ontario
For more detailed maps, please consult the maps in the appendix or the Online Map Viewer.
| Electoral district | Deviation |
|---|---|
| Mississauga Centre | 6.4% |
| Mississauga East—Cooksville | 3.1% |
| Mississauga—Erin Mills | 3.1% |
| Mississauga—Lakeshore | 2.9% |
| Mississauga—Malton | 2.7% |
| Mississauga—Streetsville | -2.4% |
The population of Mississauga has remained relatively constant, with population growth of 0.6%, from 713,443 in 2011 to 717,961 in 2021. The remainder of Ontario grew by 11.3% in the same period.
The existing six electoral districts in Mississauga would have an average 2021 population of 119,660 and an average deviation of 2.6% from the Quota. The absolute range between the least and most populous districts would be 9.5 percentage points. The populations and deviations from the Quota for the existing electoral districts are shown in Table 9A.
| Electoral Districts | Population – 2011 | Deviation from Quota – 2012 | Population – 2021 | Deviation from Quota – 2022 |
|---|---|---|---|---|
| Mississauga Centre | 118,756 | +11.81% | 127,377 | +9.25% |
| Mississauga East—Cooksville | 121,792 | +14.67% | 116,346 | -0.21% |
| Mississauga—Erin Mills | 117,199 | +10.34% | 123,371 | +5.82% |
| Mississauga—Lakeshore | 118,893 | +11.94% | 117,095 | +0.43% |
| Mississauga—Malton | 118,046 | +11.14% | 116,908 | +0.27% |
| Mississauga—Streetsville | 118,757 | +11.81% | 116,864 | +0.24% |
| Average | 118,907 | +11.95% | 119,660 | +2.63% |
| Range (most populous to least populous) | 4,593 | 4.33 pp | 11,031 | 9.46 pp |
pp = percentage points
In the proposed redistribution plan, the Commission proposed minor boundary adjustments to balance the populations of the six existing districts in Mississauga. These six proposed districts were within the municipal boundaries of the City of Mississauga, and their boundaries aligned with major roads, the Credit River, and the Canadian Pacific rail line. The populations and deviations from the Quota for the proposed districts are shown in Table 9B.
| Electoral Districts | Population – 2021 | Deviation from Quota – 2022 |
|---|---|---|
| Mississauga Centre | 119,975 | +2.90% |
| Mississauga East—Cooksville | 120,196 | +3.09% |
| Mississauga—Erin Mills | 119,526 | +2.52% |
| Mississauga Lakeshore | 119,936 | +2.87% |
| Mississauga—Malton | 119,741 | +2.70% |
| Mississauga—Meadowvale | 118,587 | +1.71% |
| Average | 119,660 | +2.63% |
| Range (most populous to least populous) | 1,609 | 1.38 pp |
pp = percentage points
Concern was expressed that the proposed redistribution, to create the proposed district of Mississauga—Meadowvale, divided the Streetsville community. There were requests to reconfigure the proposed district so as not to divide Streetsville, which has a significant community identity and history within the larger City of Mississauga. There were also requests to include reference to the Streetsville community as part of the district's name, as has been the case since 2003.
There were also submissions to expand the proposed Mississauga—Erin Mills district to include that segment captured by Highway 407, Britannia Road and Erin Mills Parkway. It was submitted that the proposed boundaries drew an unnatural boundary through the middle of the Churchill Meadows neighbourhood. The proposed new boundary drawn at Thomas Street placed the top third of the Churchill Meadows community in the new riding of Mississauga—Meadowvale. The Commission was requested to recognize the community interest identified by the residents of Erin Mills living south of Britannia Road and north of Thomas Street.
The Commission concluded that it was reasonable to implement these submissions, given that such implementation did not significantly impact voter parity. This encompasses three changes to the proposed redistribution plan.
Firstly, Streetsville was moved back into Mississauga—Meadowvale. This district's name has been returned to the existing name of Mississauga—Streetsville.
Secondly, the Churchill Meadow neighbourhood has been returned to Mississauga—Erin Mills.
Thirdly, Mississauga Centre's southwestern boundary has been moved to the Credit River.
All other boundaries in Mississauga are unchanged from the proposal, including those of Mississauga—Malton, Mississauga East—Cooksville and Mississauga—Lakeshore.
In the case of Mississauga—lakeshore, the em dash (—
) is being returned to the name of the district, as it was in the existing name. The Commission recognizes the administrative burden that comes with name changes and has decided that the existing name is preferable.
The names, populations and deviations from the Quota for Mississauga's final districts are shown in Table 9C.
| Electoral Districts | Population – 2021 | Deviation from Quota – 2022 |
|---|---|---|
| Mississauga Centre | 124,084 | +6.43% |
| Mississauga East—Cooksville | 120,196 | +3.09% |
| Mississauga—Erin Mills | 120,241 | +3.13% |
| Mississauga—Lakeshore | 119,936 | +2.87% |
| Mississauga—Malton | 119,741 | +2.70% |
| Mississauga—Streetsville | 113,763 | -2.42% |
| Average | 119,660 | +2.63% |
| Range (most populous to least populous) | 10,321 | 8.85 pp |
pp = percentage points
Brampton, Caledon, and Dufferin
Brampton, Caledon, and Dufferin - Existing Districts
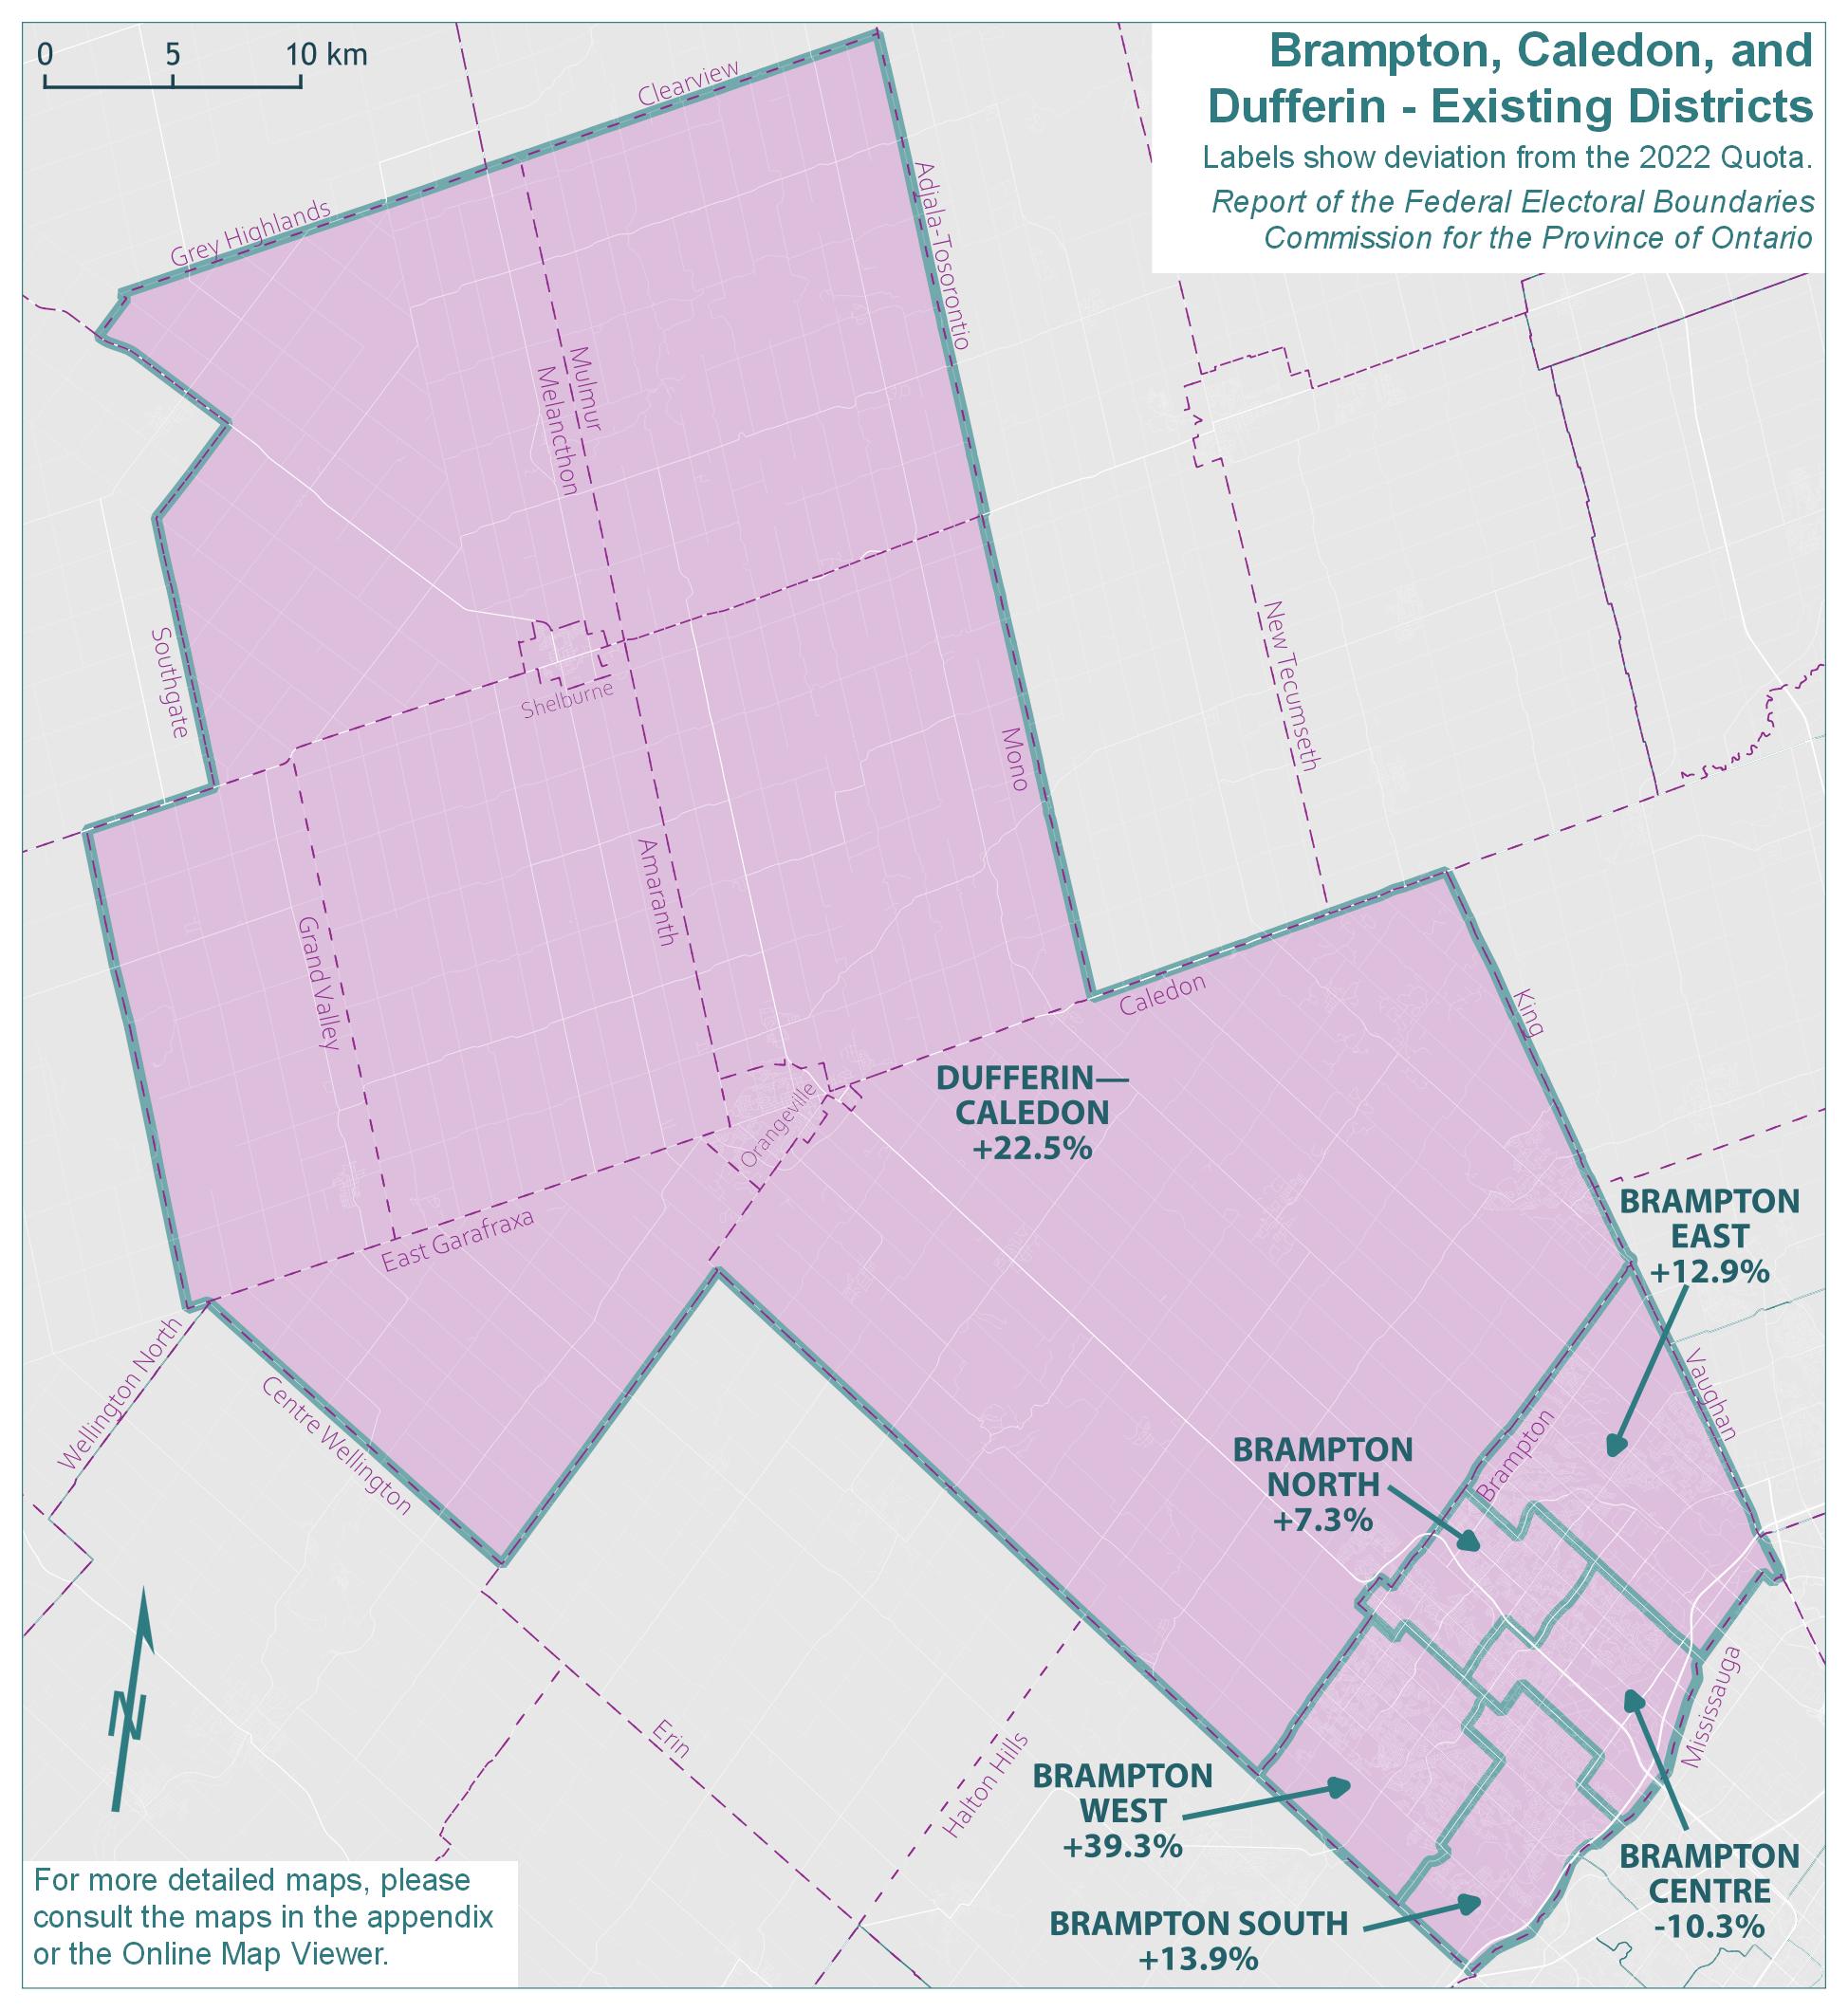
Text version of "Brampton, Caledon, and Dufferin - Existing Districts"
Labels show deviation from the 2022 Quota.
Report of the Federal Electoral Boundaries Commission for the Province of Ontario
For more detailed maps, please consult the maps in the appendix or the Online Map Viewer.
| Electoral district | Deviation |
|---|---|
| Brampton Centre | -10.3% |
| Brampton East | 12.9% |
| Brampton North | 7.3% |
| Brampton South | 13.9% |
| Brampton West | 39.3% |
| Dufferin—Caledon | 22.5% |
Brampton, Caledon, and Dufferin - Proposed Districts
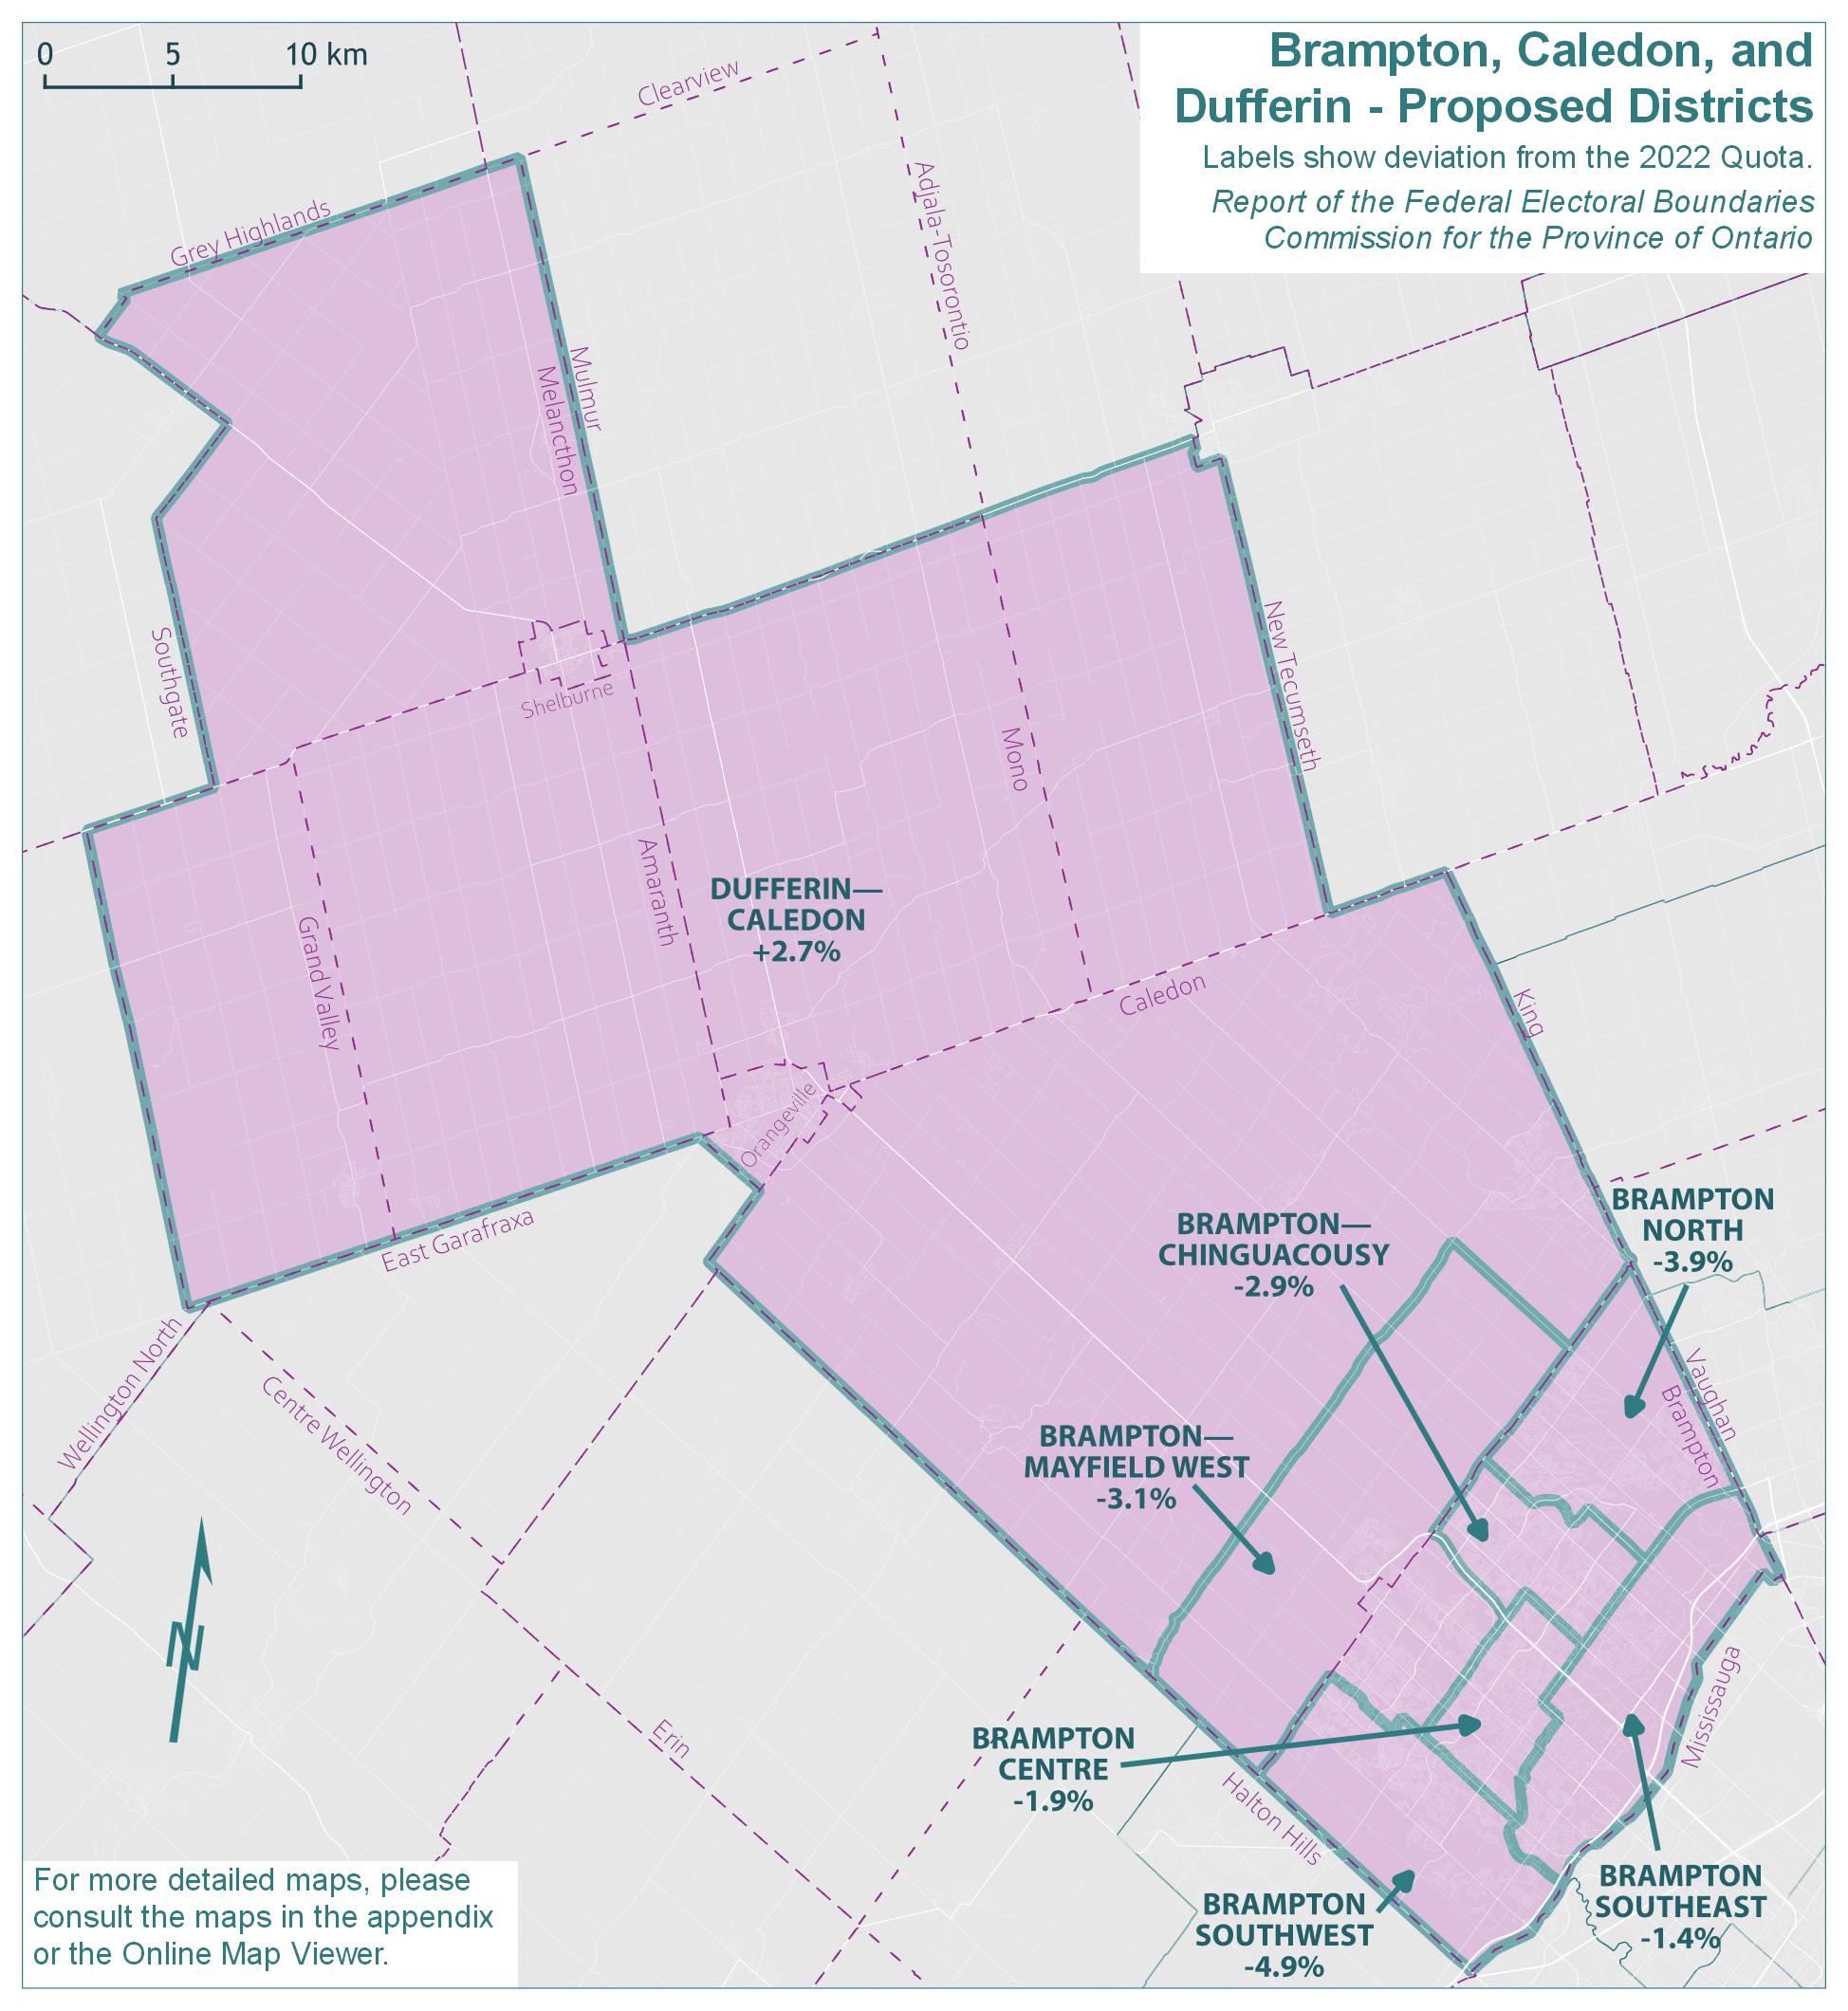
Text version of "Brampton, Caledon, and Dufferin - Proposed Districts"
Labels show deviation from the 2022 Quota.
Report of the Federal Electoral Boundaries Commission for the Province of Ontario
For more detailed maps, please consult the maps in the appendix or the Online Map Viewer.
| Electoral district | Deviation |
|---|---|
| Brampton Centre | -1.9% |
| Brampton—Chinguacousy | -2.9% |
| Brampton—Mayfield West | -3.1% |
| Brampton North | -3.9% |
| Brampton Southeast | -1.4% |
| Brampton Southwest | -4.9% |
| Dufferin—Caledon | 2.7% |
Brampton, Caledon, and Dufferin - Final Districts
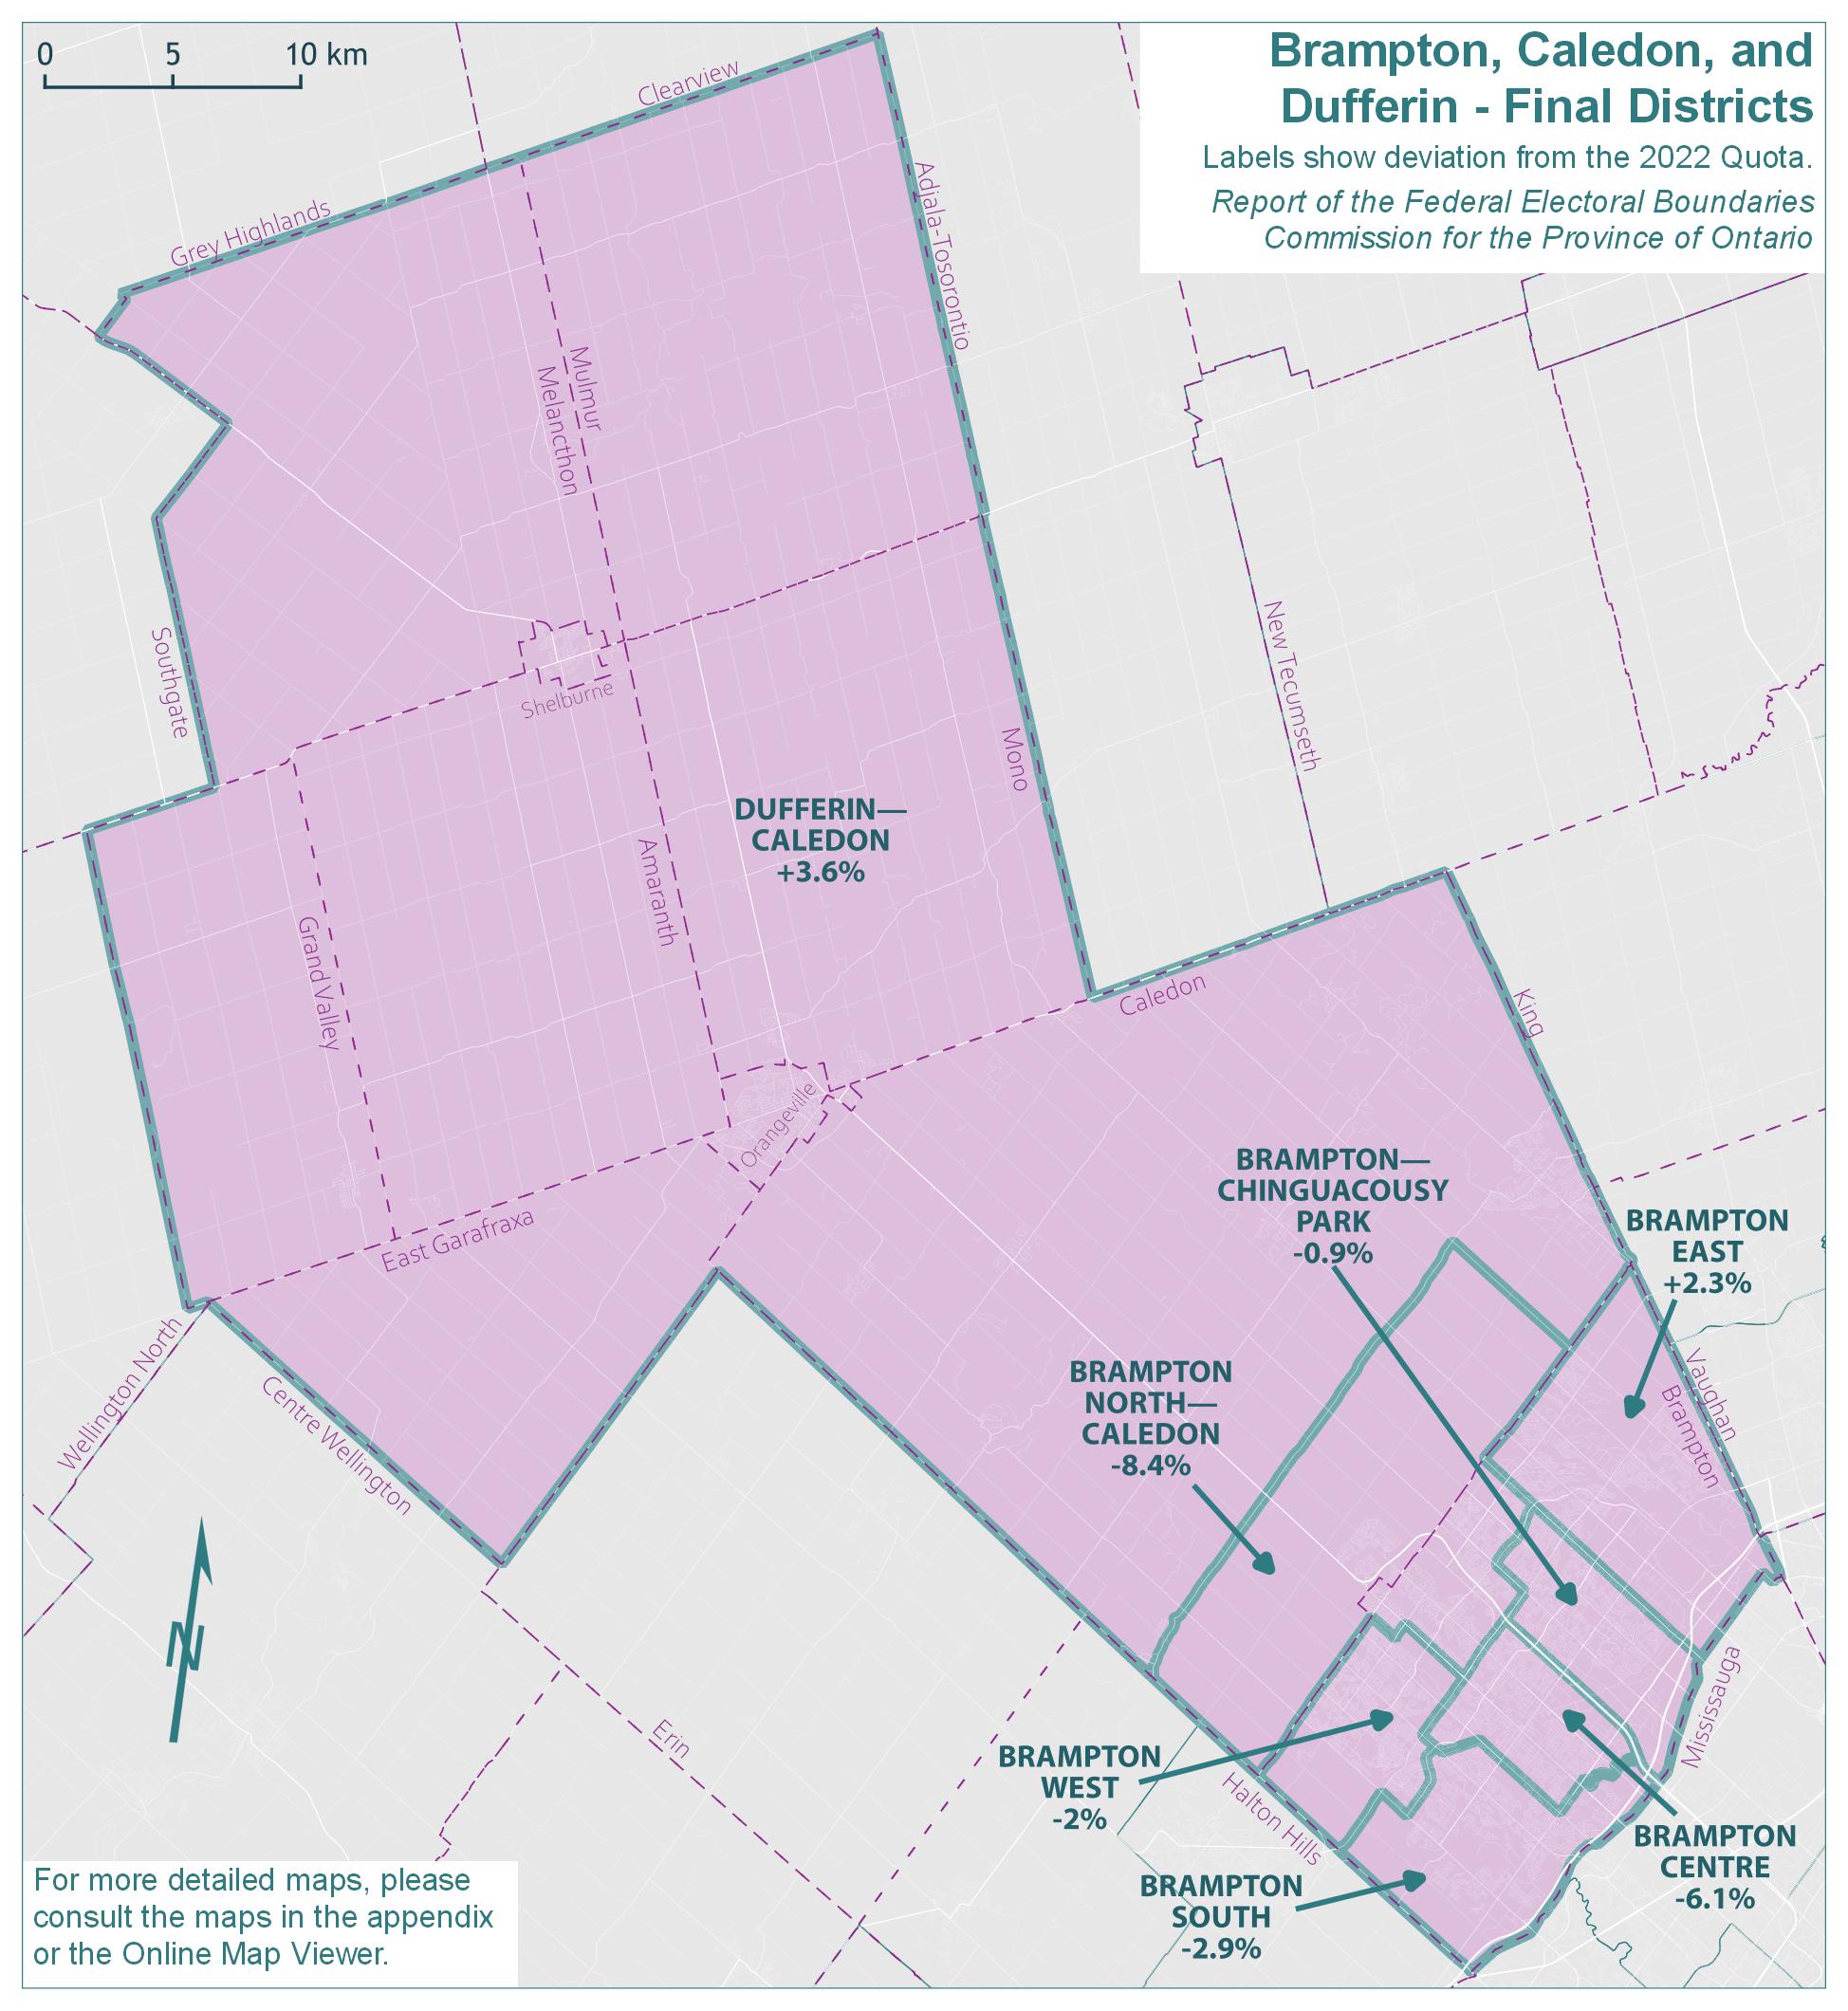
Text version of "Brampton, Caledon, and Dufferin - Final Districts"
Labels show deviation from the 2022 Quota.
Report of the Federal Electoral Boundaries Commission for the Province of Ontario
For more detailed maps, please consult the maps in the appendix or the Online Map Viewer.
| Electoral district | Deviation |
|---|---|
| Brampton Centre | -6.1% |
| Brampton East | 2.3% |
| Brampton North—Caledon | -8.4% |
| Brampton South | -2.86% |
| Brampton West | -2% |
| Brampton—Chinguacousy Park | -0.88% |
| Dufferin—Caledon | 3.62% |
Brampton was noted as an area that had seen considerable population growth over the past decade. The City of Brampton itself, with a current population of 656,480, had grown by 25.3% since 2011, with density spreading northward into Caledon and Dufferin County. This is the largest population growth of any Ontario city with a population over 100,000. Taken as a geographic piece, the population of Brampton, Caledon, and Dufferin grew by 24.8%, from 640,247 in 2011 to 799,318 in 2021. The remainder of Ontario grew by 9.9% in the same period.
The six existing electoral districts in this geographic piece would have an average 2021 population of 133,220, which falls 14.3% above the Quota. Brampton West (with 162,353 residents) currently has the highest population of all districts in the province, while Dufferin—Caledon also falls near the top. As indicated by the deviation range (49.6 percentage points) relative to the 2022 Quota, there are substantial disparities in population size between districts, particularly between the adjacent ridings of Brampton West and Brampton Centre. The populations and deviations from the Quota for the existing electoral districts are shown in Table 10A.
| Electoral Districts | Population – 2011 | Deviation from Quota – 2012 | Population – 2021 | Deviation from Quota – 2022 |
|---|---|---|---|---|
| Brampton Centre | 103,122 | -2.91% | 104,557 | -10.32% |
| Brampton East | 99,712 | -6.12% | 131,677 | +12.94% |
| Brampton North | 111,951 | +5.40% | 125,141 | +7.33% |
| Brampton South | 107,364 | +1.08% | 132,752 | +13.86% |
| Brampton West | 101,757 | -4.20% | 162,353 | +39.25% |
| Dufferin—Caledon | 116,341 | +9.53% | 142,838 | +22.51% |
| Average | 106,708 | +0.46% | 133,220 | +14.26% |
| Range (most populous to least populous) | 16,629 | 15.65 pp | 57,796 | 49.57 pp |
pp = percentage points
Given its population size and pattern of growth, the Commission concluded that this area required a new electoral district.
The proposed addition of a seventh district, together with the obligation to address the wide population disparities described above, required significant boundary reconfigurations, especially of those districts that lay within the City of Brampton. The populations and deviations from the Quota for the proposed redistribution plan are shown in Table 10B.
| Electoral Districts | Population – 2021 | Deviation from Quota – 2022 |
|---|---|---|
| Brampton Centre | 114,422 | -1.86% |
| Brampton—Chinguacousy | 113,201 | -2.91% |
| Brampton—Mayfield West | 112,994 | -3.08% |
| Brampton North | 112,082 | -3.87% |
| Brampton Southeast | 114,952 | -1.40% |
| Brampton Southwest | 110,855 | -4.92% |
| Dufferin—Caledon | 119,767 | +2.72% |
| Average | 114,039 | -2.19% |
| Range (most populous to least populous) | 8,912 | 7.64 pp |
pp = percentage points
One of the main issues of the submissions respecting the proposed redistribution plan for this geographic piece related to the riding names proposed by the Commission which reflected cardinal directions. It was revealed that the existing names and directions were preferred, which correspond to the road grid instead of the literal directions. The Commission felt it was appropriate to acknowledge local orientations and the traditional district names were therefore restored — Brampton East, Brampton South, and Brampton West.
It was noted that Mayfield
in the proposed name Brampton—Mayfield West was not historically significant nor was that name significant to anyone other than those who lived in that immediate area. As a result, the Commission has revised the name to Brampton North—Caledon as it was suggested this better reflected the location of the district as it straddled the boundary between the municipalities of Brampton and Caledon.
Concern was expressed regarding the inclusion of Chinguacousy
which is in use throughout the City of Brampton and thus would not reference the specific location of the district. As a result, it was decided that the riding should be named Brampton—Chinguacousy Park as suggested, to reflect that the riding now encompasses the 40-hectare Donald M. Gordon Chinguacousy Park.
The focus of other submissions related to historical patterns and communities of interest.
In the proposed redistribution plan, the historical centre of the City of Brampton was divided, and the Commission was urged to retain historical Brampton, including Armbro Heights, Peel Village and Four Corners, within the same district, Brampton Centre. Significant community projects and infrastructure improvements are in progress which would benefit from cohesive common representation.
Similarly, the Commission was advised of the importance of keeping together the newly established developments around Mississauga Road and Steeles Avenue, including the Susan Fennell Sportsplex and the Churchville community in the district of Brampton South; Heart Lake, Loafer's Lake, and Springdale in Brampton North; and the Cassie Campbell Community Centre and multiple places of worship in Brampton West. The Commission implemented these submissions which respected communities of interest and did not disturb the achievement of voter parity.
Brampton East has been mostly shifted back to its existing position, except in the northwestern corner. The final western boundary will follow Tobram Road in its entirety, making for a clear, simple boundary.
The Township of East Garafraxa and the Township of Mulmur sought to join Dufferin—Caledon which would keep them with all the other municipalities in Dufferin County. Again, because these additions supported effective representation and did not interfere with voter parity, the Commission implemented these submissions.
The names, populations and deviations from the Quota for Brampton, Caledon, and Dufferin's final districts are shown in Table 10C.
| Electoral Districts | Population – 2021 | Deviation from Quota – 2022 |
|---|---|---|
| Brampton Centre | 109,450 | -6.12% |
| Brampton—Chinguacousy Park | 115,568 | -0.88% |
| Brampton East | 119,214 | +2.25% |
| Brampton North—Caledon | 106,762 | -8.43% |
| Brampton South | 113,252 | -2.86% |
| Brampton West | 114,260 | -2.00% |
| Dufferin—Caledon | 120,812 | +3.62% |
| Average | 114,188 | -2.06% |
| Range (most populous to least populous) | 14,050 | 12.05 pp |
pp = percentage points
Halton, Guelph, and Wellington
Halton, Guelph, and Wellington - Existing Districts
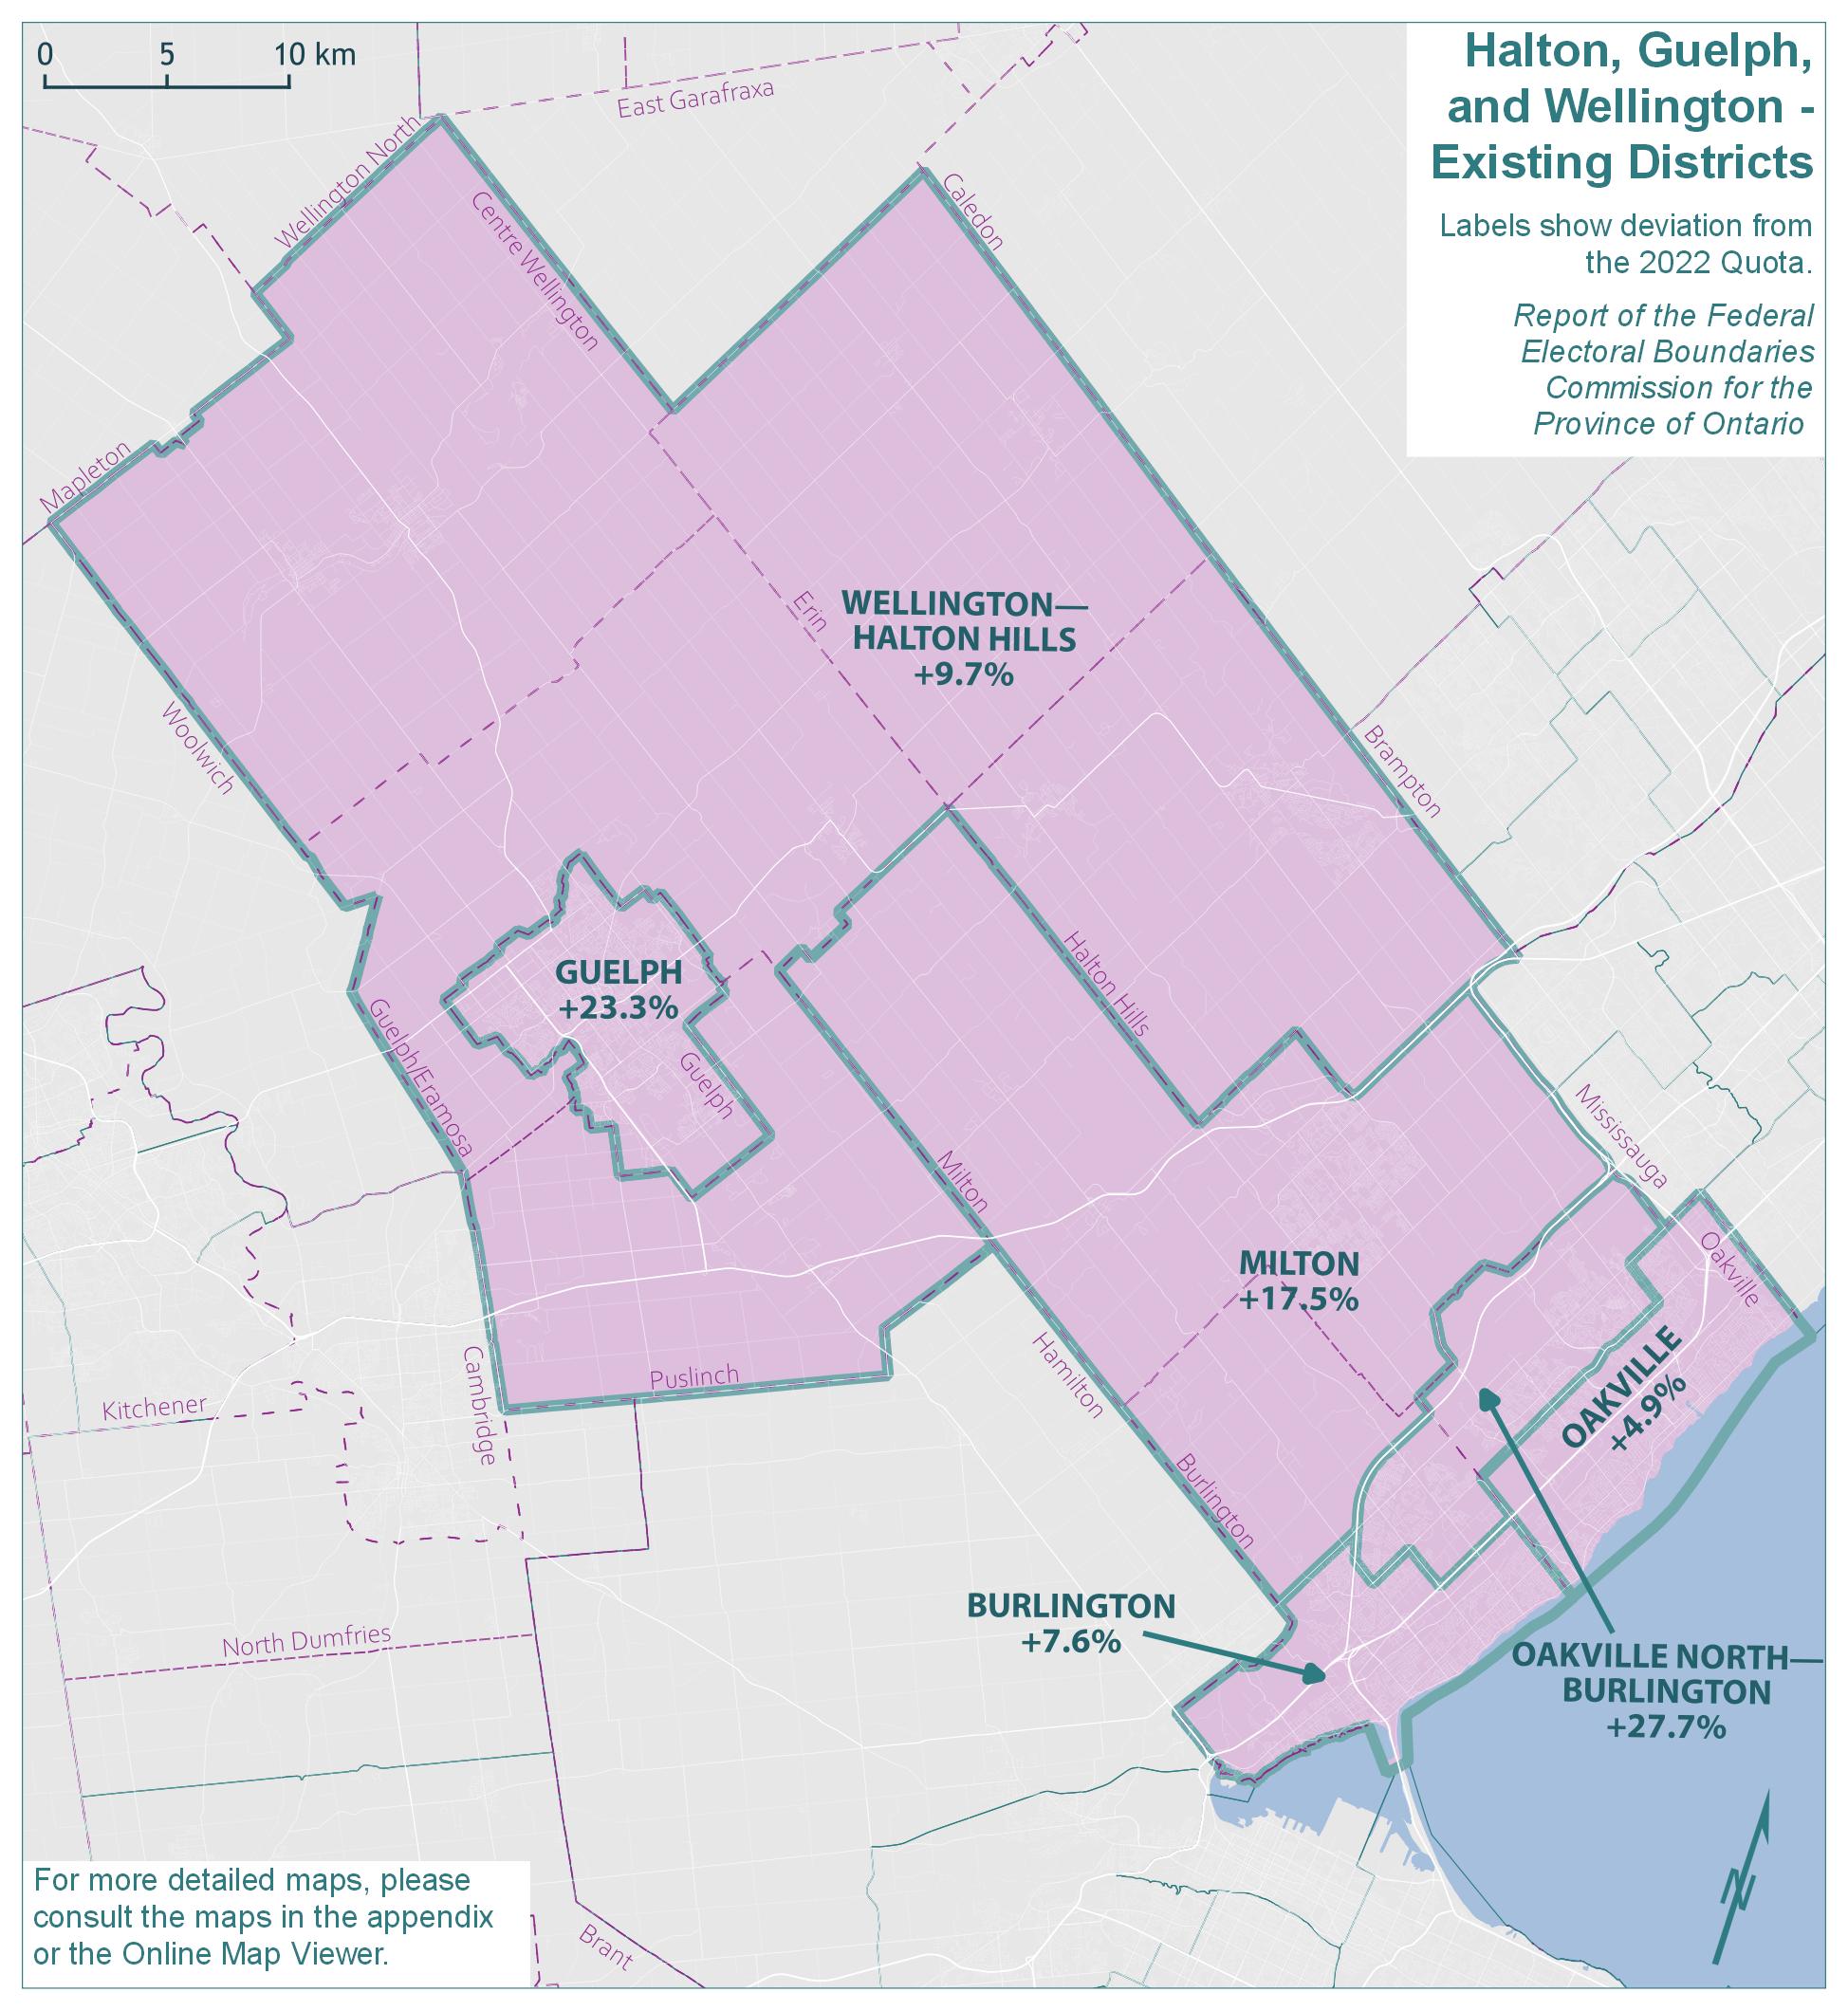
Text version of "Halton, Guelph, and Wellington - Existing Districts"
Labels show deviation from the 2022 Quota.
Report of the Federal Electoral Boundaries Commission for the Province of Ontario
For more detailed maps, please consult the maps in the appendix or the Online Map Viewer.
| Electoral district | Deviation |
|---|---|
| Burlington | 7.6% |
| Guelph | 23.3% |
| Milton | 17.5% |
| Oakville | 4.9% |
| Oakville North—Burlington | 27.7% |
| Wellington—Halton Hills | 9.7% |
Halton, Guelph, and Wellington - Proposed Districts
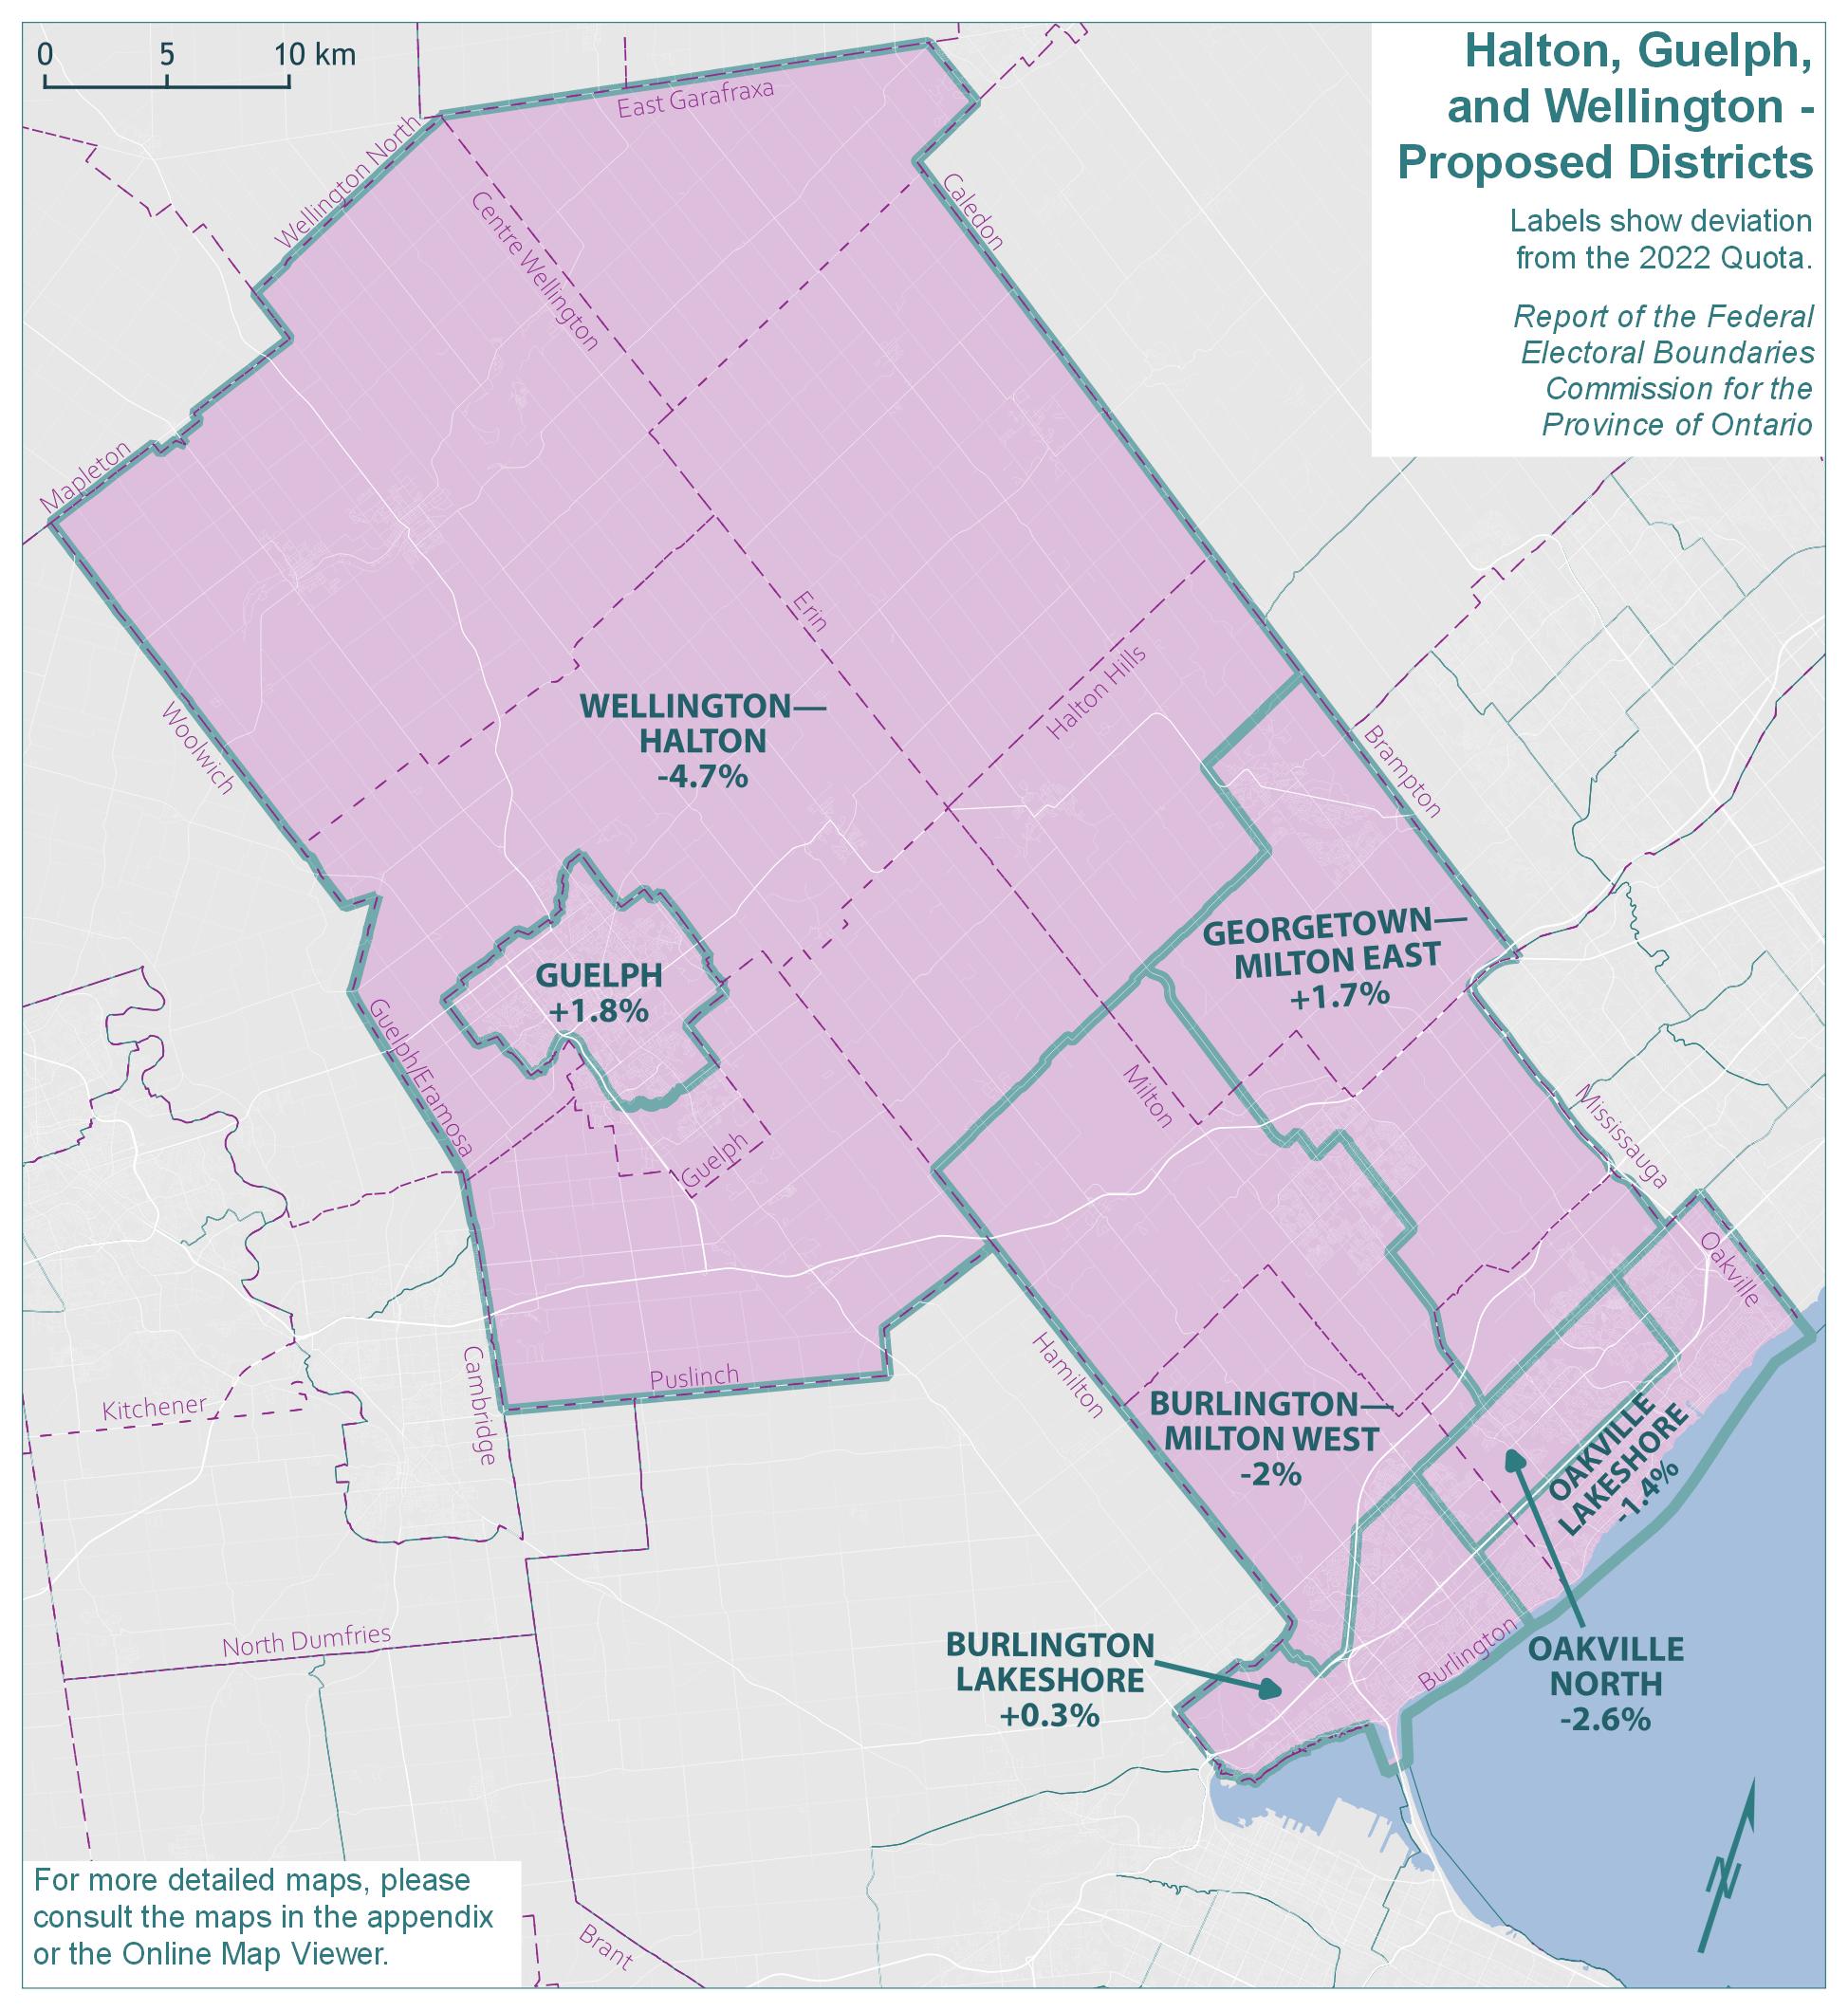
Text version of "Halton, Guelph, and Wellington - Proposed Districts"
Labels show deviation from the 2022 Quota.
Report of the Federal Electoral Boundaries Commission for the Province of Ontario
For more detailed maps, please consult the maps in the appendix or the Online Map Viewer.
| Electoral district | Deviation |
|---|---|
| Burlington Lakeshore | 0.3% |
| Burlington—Milton West | -2.0% |
| Georgetown—Milton East | 1.7% |
| Guelph | 1.8% |
| Oakville Lakeshore | -1.4% |
| Oakville North | -2.6% |
| Wellington—Halton | -4.7% |
Halton, Guelph, and Wellington - Final Districts
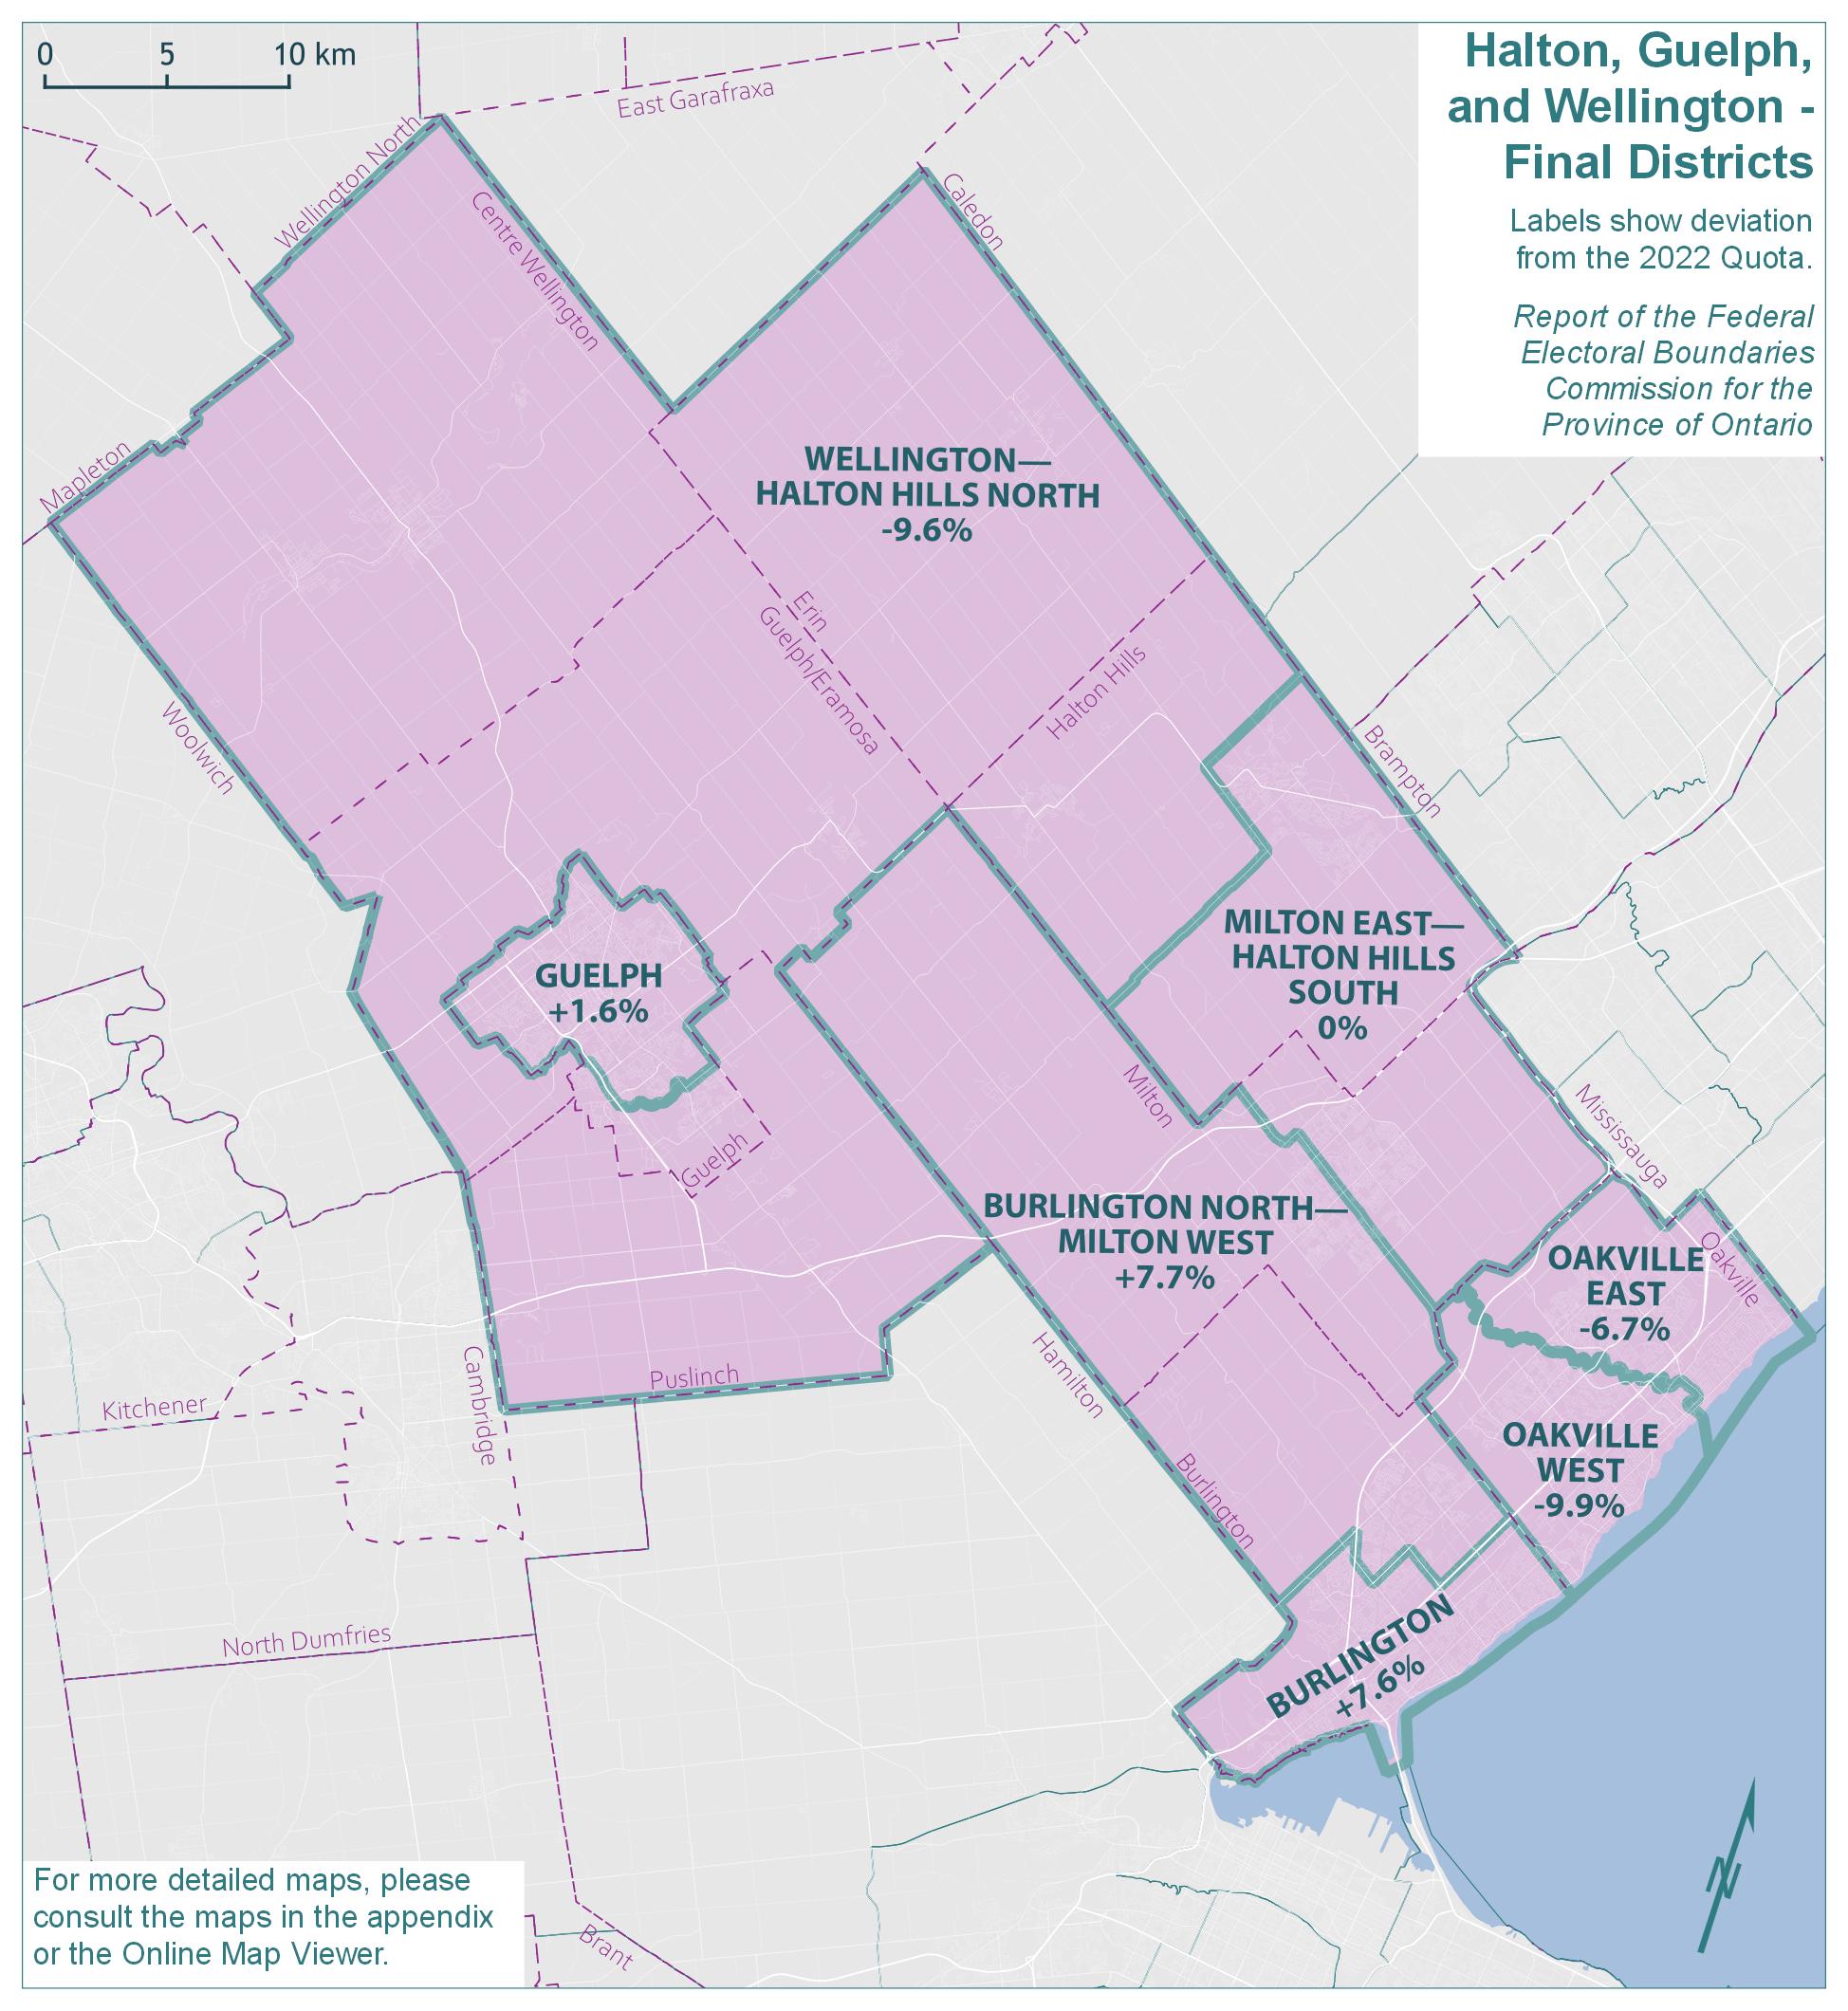
Text version of "Halton, Guelph, and Wellington - Final Districts"
Labels show deviation from the 2022 Quota.
Report of the Federal Electoral Boundaries Commission for the Province of Ontario
For more detailed maps, please consult the maps in the appendix or the Online Map Viewer.
| Electoral district | Deviation |
|---|---|
| Burlington | 7.6% |
| Burlington North—Milton West | 7.7% |
| Guelph | 1.6% |
| Milton East—Halton Hills South | 0% |
| Oakville East | -6.7% |
| Oakville West | -9.9% |
The population of Halton, Guelph, and Wellington grew by 18.4%, from 680,234 in 2011 to 805,299 in 2021. The remainder of Ontario grew by 10.2% in the same period.
The six electoral districts in this geographic piece would have an average 2021 population of 134,217 and an average deviation of 15.1% above the Quota. The existing districts of Oakville North—Burlington, Guelph and Milton are at the highest end for population size across the province, with populations that are, respectively, 27.7%, 23.3% and 17.5% above the Quota. The populations and deviations from the Quota for the existing electoral districts are shown in Table 11A.
| Electoral Districts | Population – 2011 | Deviation from Quota – 2012 | Population – 2021 | Deviation from Quota – 2022 |
|---|---|---|---|---|
| Burlington | 120,569 | +13.52% | 125,435 | +7.59% |
| Guelph | 121,688 | +14.57% | 143,740 | +23.29% |
| Milton | 88,065 | -17.09% | 136,993 | +17.50% |
| Oakville | 119,649 | +12.65% | 122,322 | +4.92% |
| Oakville North—Burlington | 114,378 | +7.69% | 148,936 | +27.74% |
| Wellington—Halton Hills | 115,885 | +9.11% | 127,873 | +9.68% |
| Average | 113,372 | +6.74% | 134,217 | +15.12% |
| Range (most populous to least populous) | 33,623 | 31.66 pp | 26,614 | 22.82 pp |
pp = percentage points
The Commission proposed a new electoral district to resolve the underrepresentation in this area, so that it would comprise seven districts with more balanced populations. In this process, several other changes were made, significantly altering the existing districts. The populations and deviations from the Quota for the proposed districts are shown in Table 11B.
| Electoral Districts | Population – 2021 | Deviation from Quota – 2022 |
|---|---|---|
| Burlington Lakeshore | 116,984 | +0.34% |
| Burlington—Milton West | 114,218 | -2.03% |
| Georgetown—Milton East | 118,559 | +1.69% |
| Guelph | 118,686 | +1.80% |
| Oakville Lakeshore | 114,917 | -1.43% |
| Oakville North | 113,574 | -2.59% |
| Wellington—Halton | 111,155 | -4.66% |
| Average | 115,442 | -0.98% |
| Range (most populous to least populous) | 7,531 | 6.46 pp |
pp = percentage points
While the additional seat was welcomed, there were nevertheless objections where district boundaries did not align with municipal borders. Some of these concerns are unnecessary. For example, there is no risk that residents' property taxes or access to their local hospital will be impacted as a result of being in a district that crosses into the neighbouring city.
Nevertheless, the Commission appreciates that where municipalities are too populous to be contained within a single district, it is generally preferable to divide them into larger portions across a maximum of two ridings, than to distribute small segments among three or four, as the proposal did in some instances. Several adjustments were thus made so that communities now hold sufficient weight in their new districts.
Consistent with the motion received from the Town of Oakville, and widely endorsed in submissions from residents, we have reorganized the two Oakville districts (Oakville and Oakville North—Burlington) from their current north-south alignment into eastern and western halves, creating Oakville East and Oakville West. Sixteen Mile Creek serves as a clear natural boundary that divides the Town neatly in half. This solution offers at least two substantial improvements over the initial proposal: it better respects Oakville's municipal boundaries with Burlington (to the west) and Milton (to the north); and it allows for a better blending of differential north/south population growth across both Oakville districts. A third benefit is that the east-west alignment produces two districts that are more socioeconomically balanced, thereby avoiding what one submission referred to as the gentrifying
of one district over another.
There were also strong objections to the Commission's initial proposal as it impacted the City of Burlington, which had been divided across four electoral districts. The adjustment to Oakville described above allows us to return the district of Burlington to its existing boundaries, thus keeping the communities of Tyandaga, Brant Hills and Elizabeth Gardens, which had been severed in the proposal. As the district has returned to its existing boundaries, the name will be changed back to its original name of Burlington.
The quadrant of the City of Burlington that lies within the existing district of Oakville North—Burlington now transfers to Burlington North—Milton West. It is important to note that Burlington comprises 49% of the population of this new district, with Milton comprising 51%.
In light of the population growth in and around Milton, there was general acceptance of the Commission's proposal to establish two districts in this area with the Town of Milton divided into eastern and western halves. However, we have shifted the boundary to Ontario Street, following advice that this serves as a clearer dividing line.
Given the need to respect reasonable variances from Quota, it was not possible to satisfy requests to keep the Town of Halton Hills whole within this piece. While Acton will stay in the district of Wellington—Halton Hills North, Georgetown now falls within the district of Milton East—Halton Hills South.
Wellington—Halton Hills North has received some other small changes since the proposal. The Township of East Garafraxa was moved into Dufferin—Caledon, with the remainder of Dufferin County. The boundary with Burlington North—Milton West has been changed to match the municipal limits.
The Commission has made only modest adjustments to the boundaries concerning Guelph and Wellington—Halton Hills North. Like Milton, Guelph is another area of high population growth. Here, and in other areas of the province, we received a few objections to donut
shaped arrangements where segments from the urban district are shaved off and transferred to the surrounding rural district to achieve relative population parity. While such solutions tend not to generate much immediate controversy (perhaps because they stay close to the status quo), over time they may become less reasonable as suburban populations continue to grow. If these growth patterns continue, in future it may be preferable to draw a more natural east-west or north-south split through the City of Guelph.
Guelph's new southern boundary will be along Hanlon Parkway, Hanlon's Creek, and Arkell Road, with areas south of this line being in Wellington—Halton Hills North.
The names, populations and deviations from the Quota for Halton, Guelph, and Wellington's final districts are shown in Table 11C.
| Electoral Districts | Population – 2021 | Deviation from Quota – 2022 |
|---|---|---|
| Burlington | 125,435 | +7.59% |
| Burlington North—Milton West | 125,575 | +7.71% |
| Guelph | 118,498 | +1.64% |
| Milton East—Halton Hills South | 116,592 | 0.00% |
| Oakville East | 108,735 | -6.74% |
| Oakville West | 105,024 | -9.92% |
| Wellington—Halton Hills North | 105,440 | -9.56% |
| Average | 115,043 | -1.33% |
| Range (most populous to least populous) | 20,551 | 17.63 pp |
pp = percentage points
Hamilton and Niagara
Hamilton and Niagara - Existing Districts
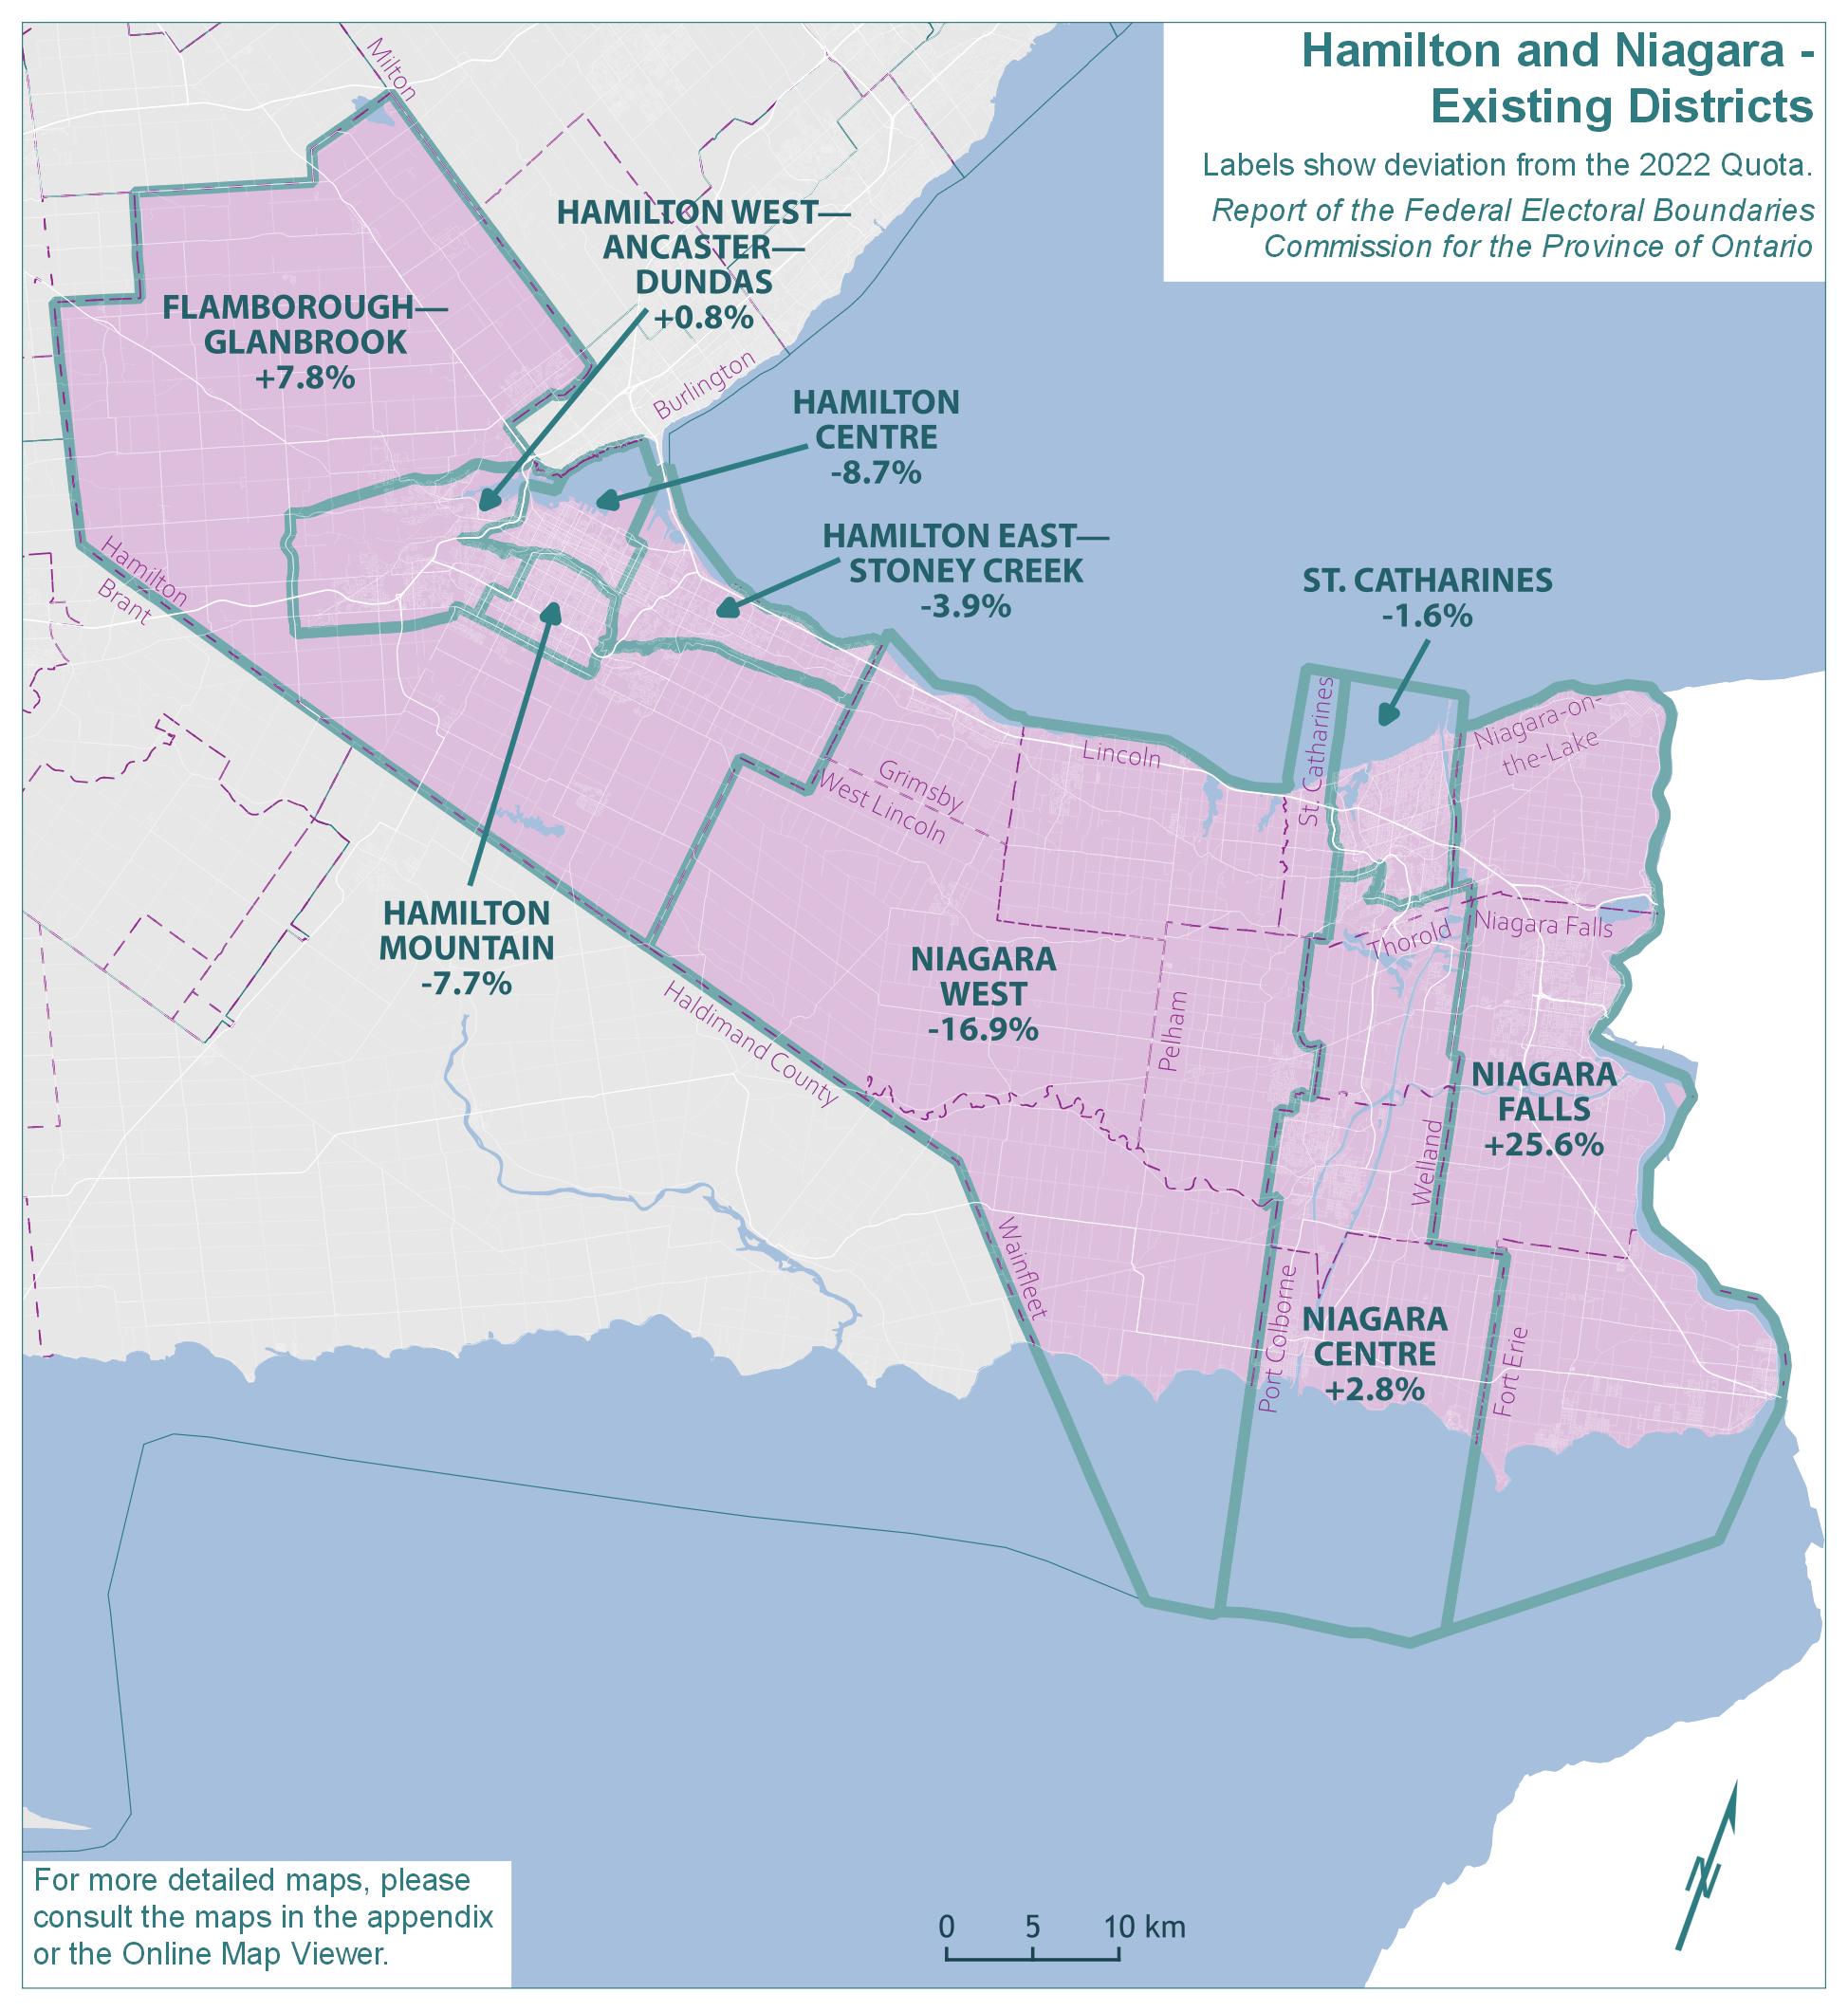
Text version of "Hamilton and Niagara - Existing Districts"
Labels show deviation from the 2022 Quota.
Report of the Federal Electoral Boundaries Commission for the Province of Ontario
For more detailed maps, please consult the maps in the appendix or the Online Map Viewer.
| Electoral district | Deviation |
|---|---|
| Flamborough—Glanbrook | 7.8% |
| Hamilton Centre | -8.7% |
| Hamilton East—Stoney Creek | -3.9% |
| Hamilton Mountain | -7.7% |
| Hamilton West—Ancaster—Dundas | 0.8% |
| Niagara Centre | 2.8% |
| Niagara Falls | 25.6% |
| Niagara West | -16.9% |
| St. Catharines | -1.6% |
Hamilton and Niagara - Proposed Districts
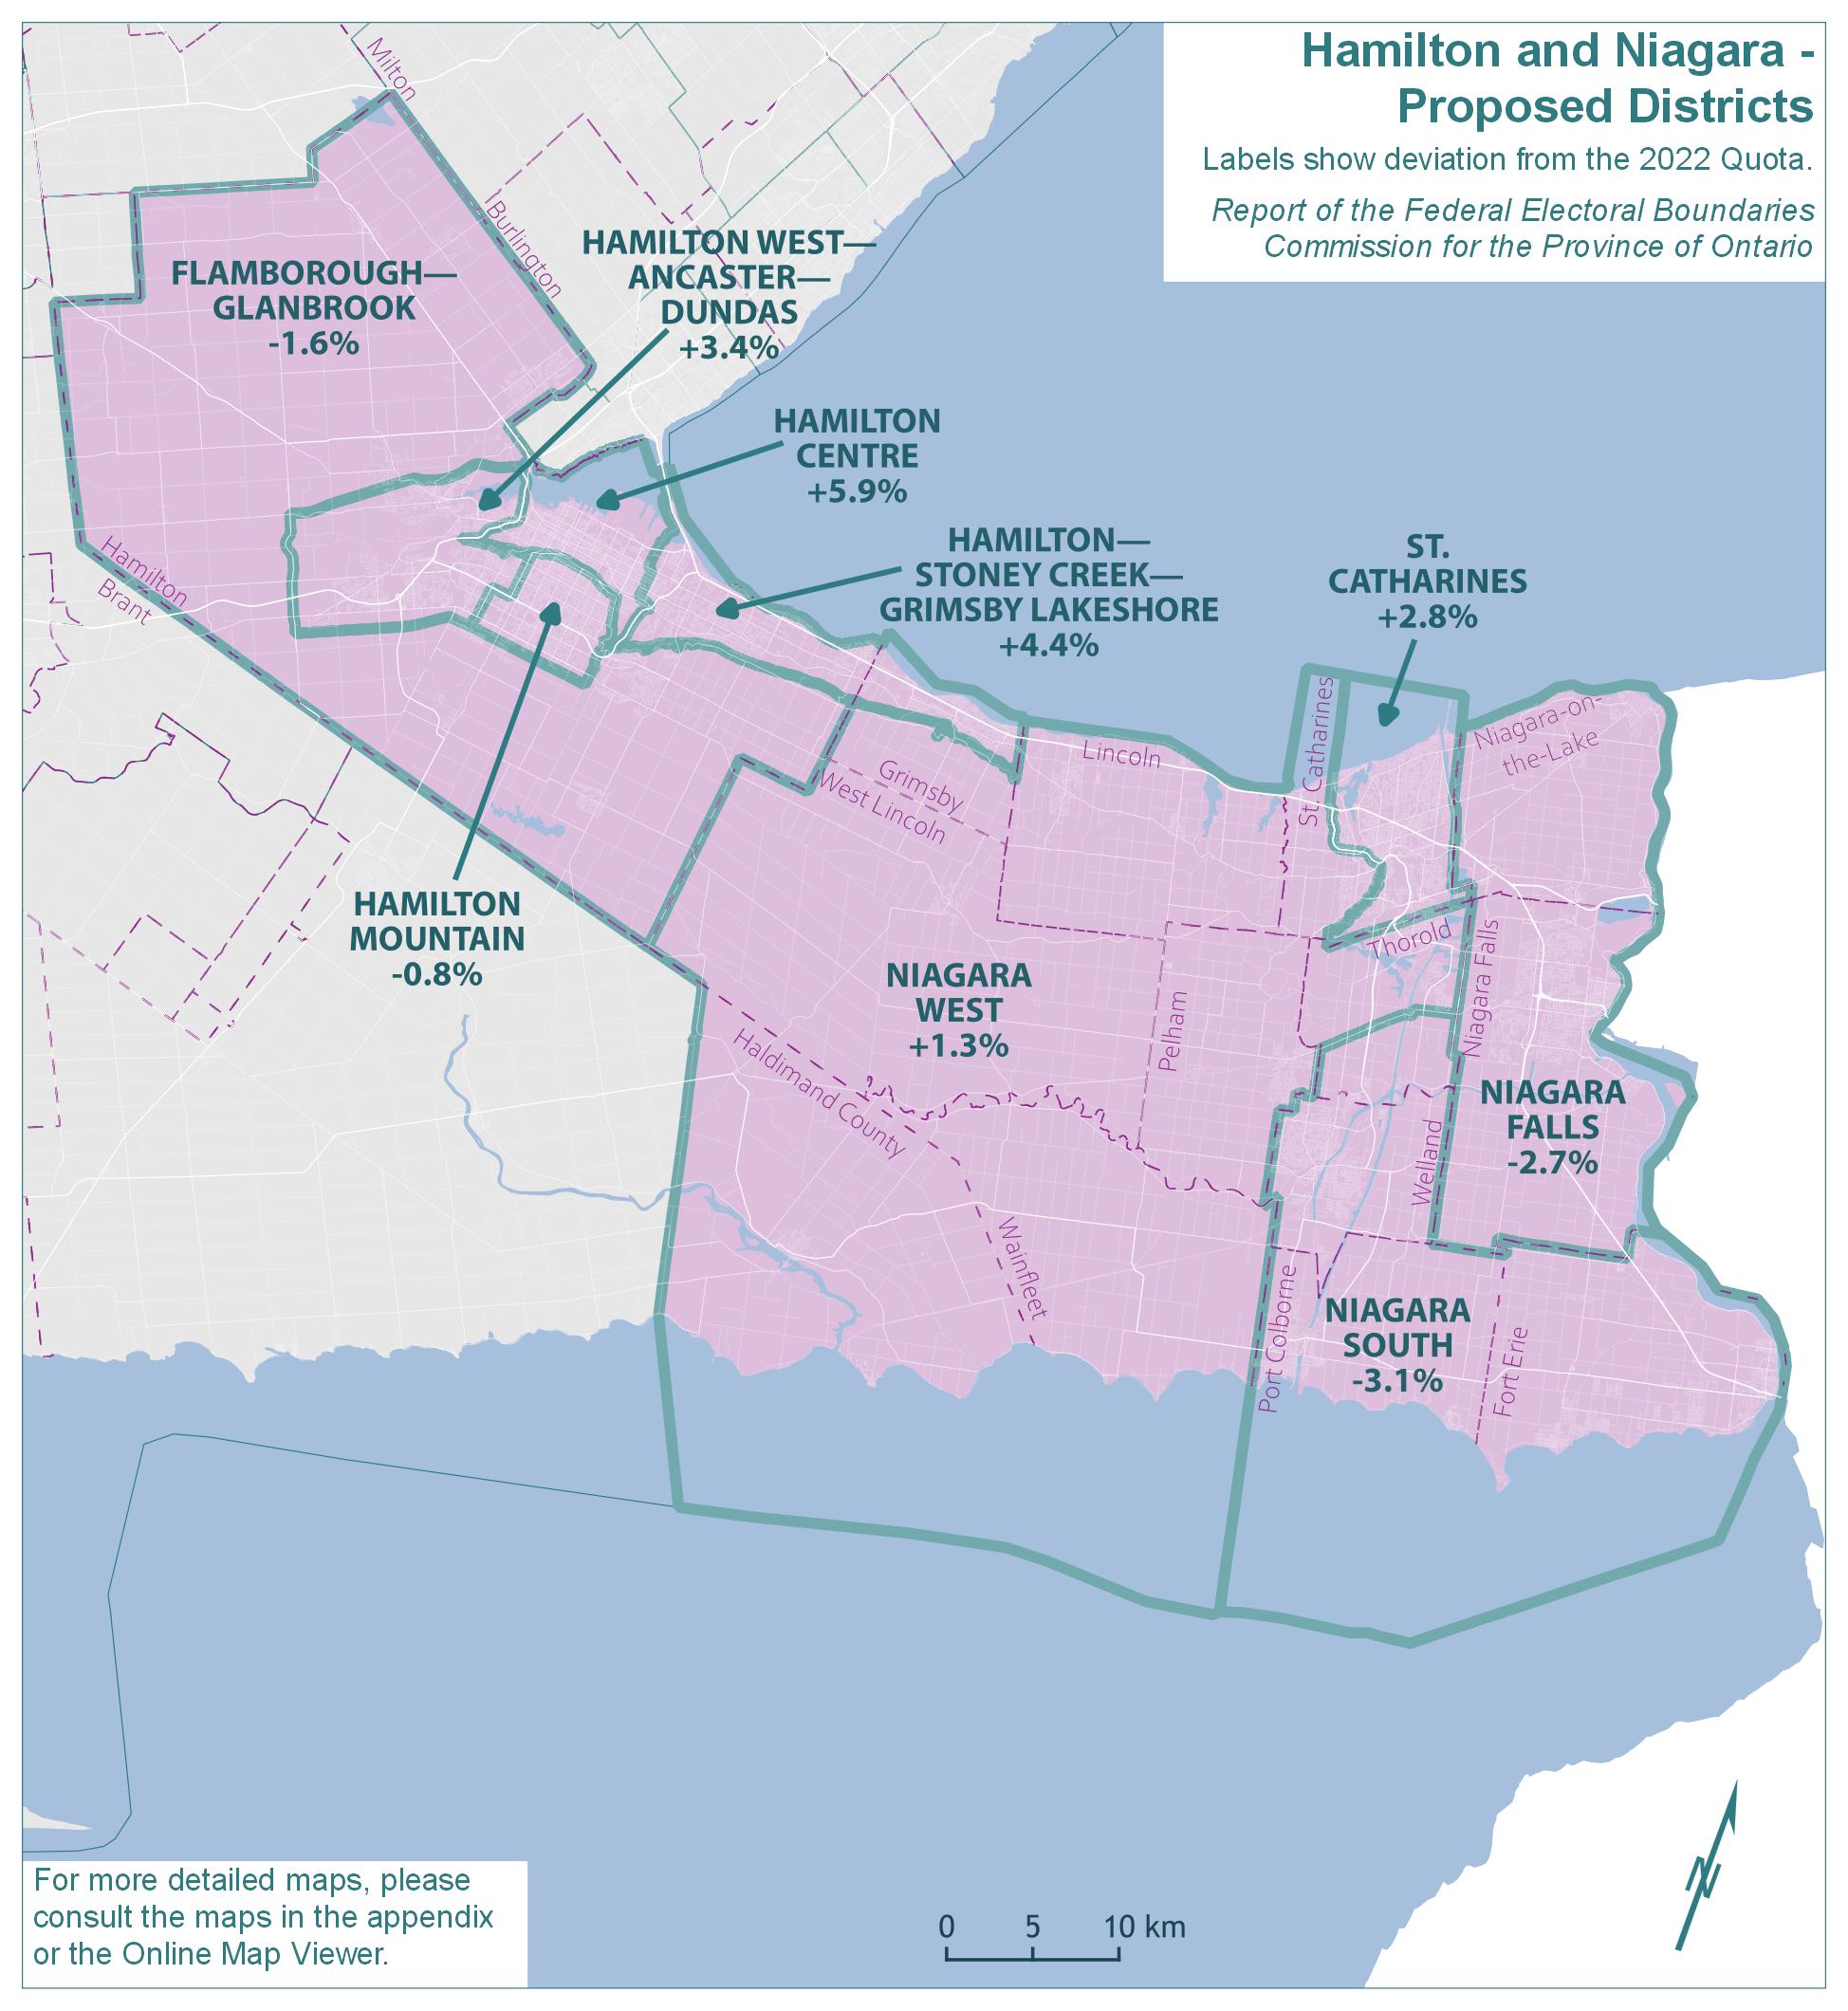
Text version of "Hamilton and Niagara - Proposed Districts"
Labels show deviation from the 2022 Quota.
Report of the Federal Electoral Boundaries Commission for the Province of Ontario
For more detailed maps, please consult the maps in the appendix or the Online Map Viewer.
| Electoral district | Deviation |
|---|---|
| Flamborough—Glanbrook | -1.6% |
| Hamilton Centre | 5.9% |
| Hamilton Mountain | -0.8% |
| Hamilton—Stoney Creek—Grimsby Lakeshore | 4.4% |
| Hamilton West—Ancaster—Dundas | 3.4% |
| Niagara Falls | -2.7% |
| Niagara South | -3.1% |
| Niagara West | 1.3% |
| St. Catharines | 2.8% |
Hamilton and Niagara - Final Districts
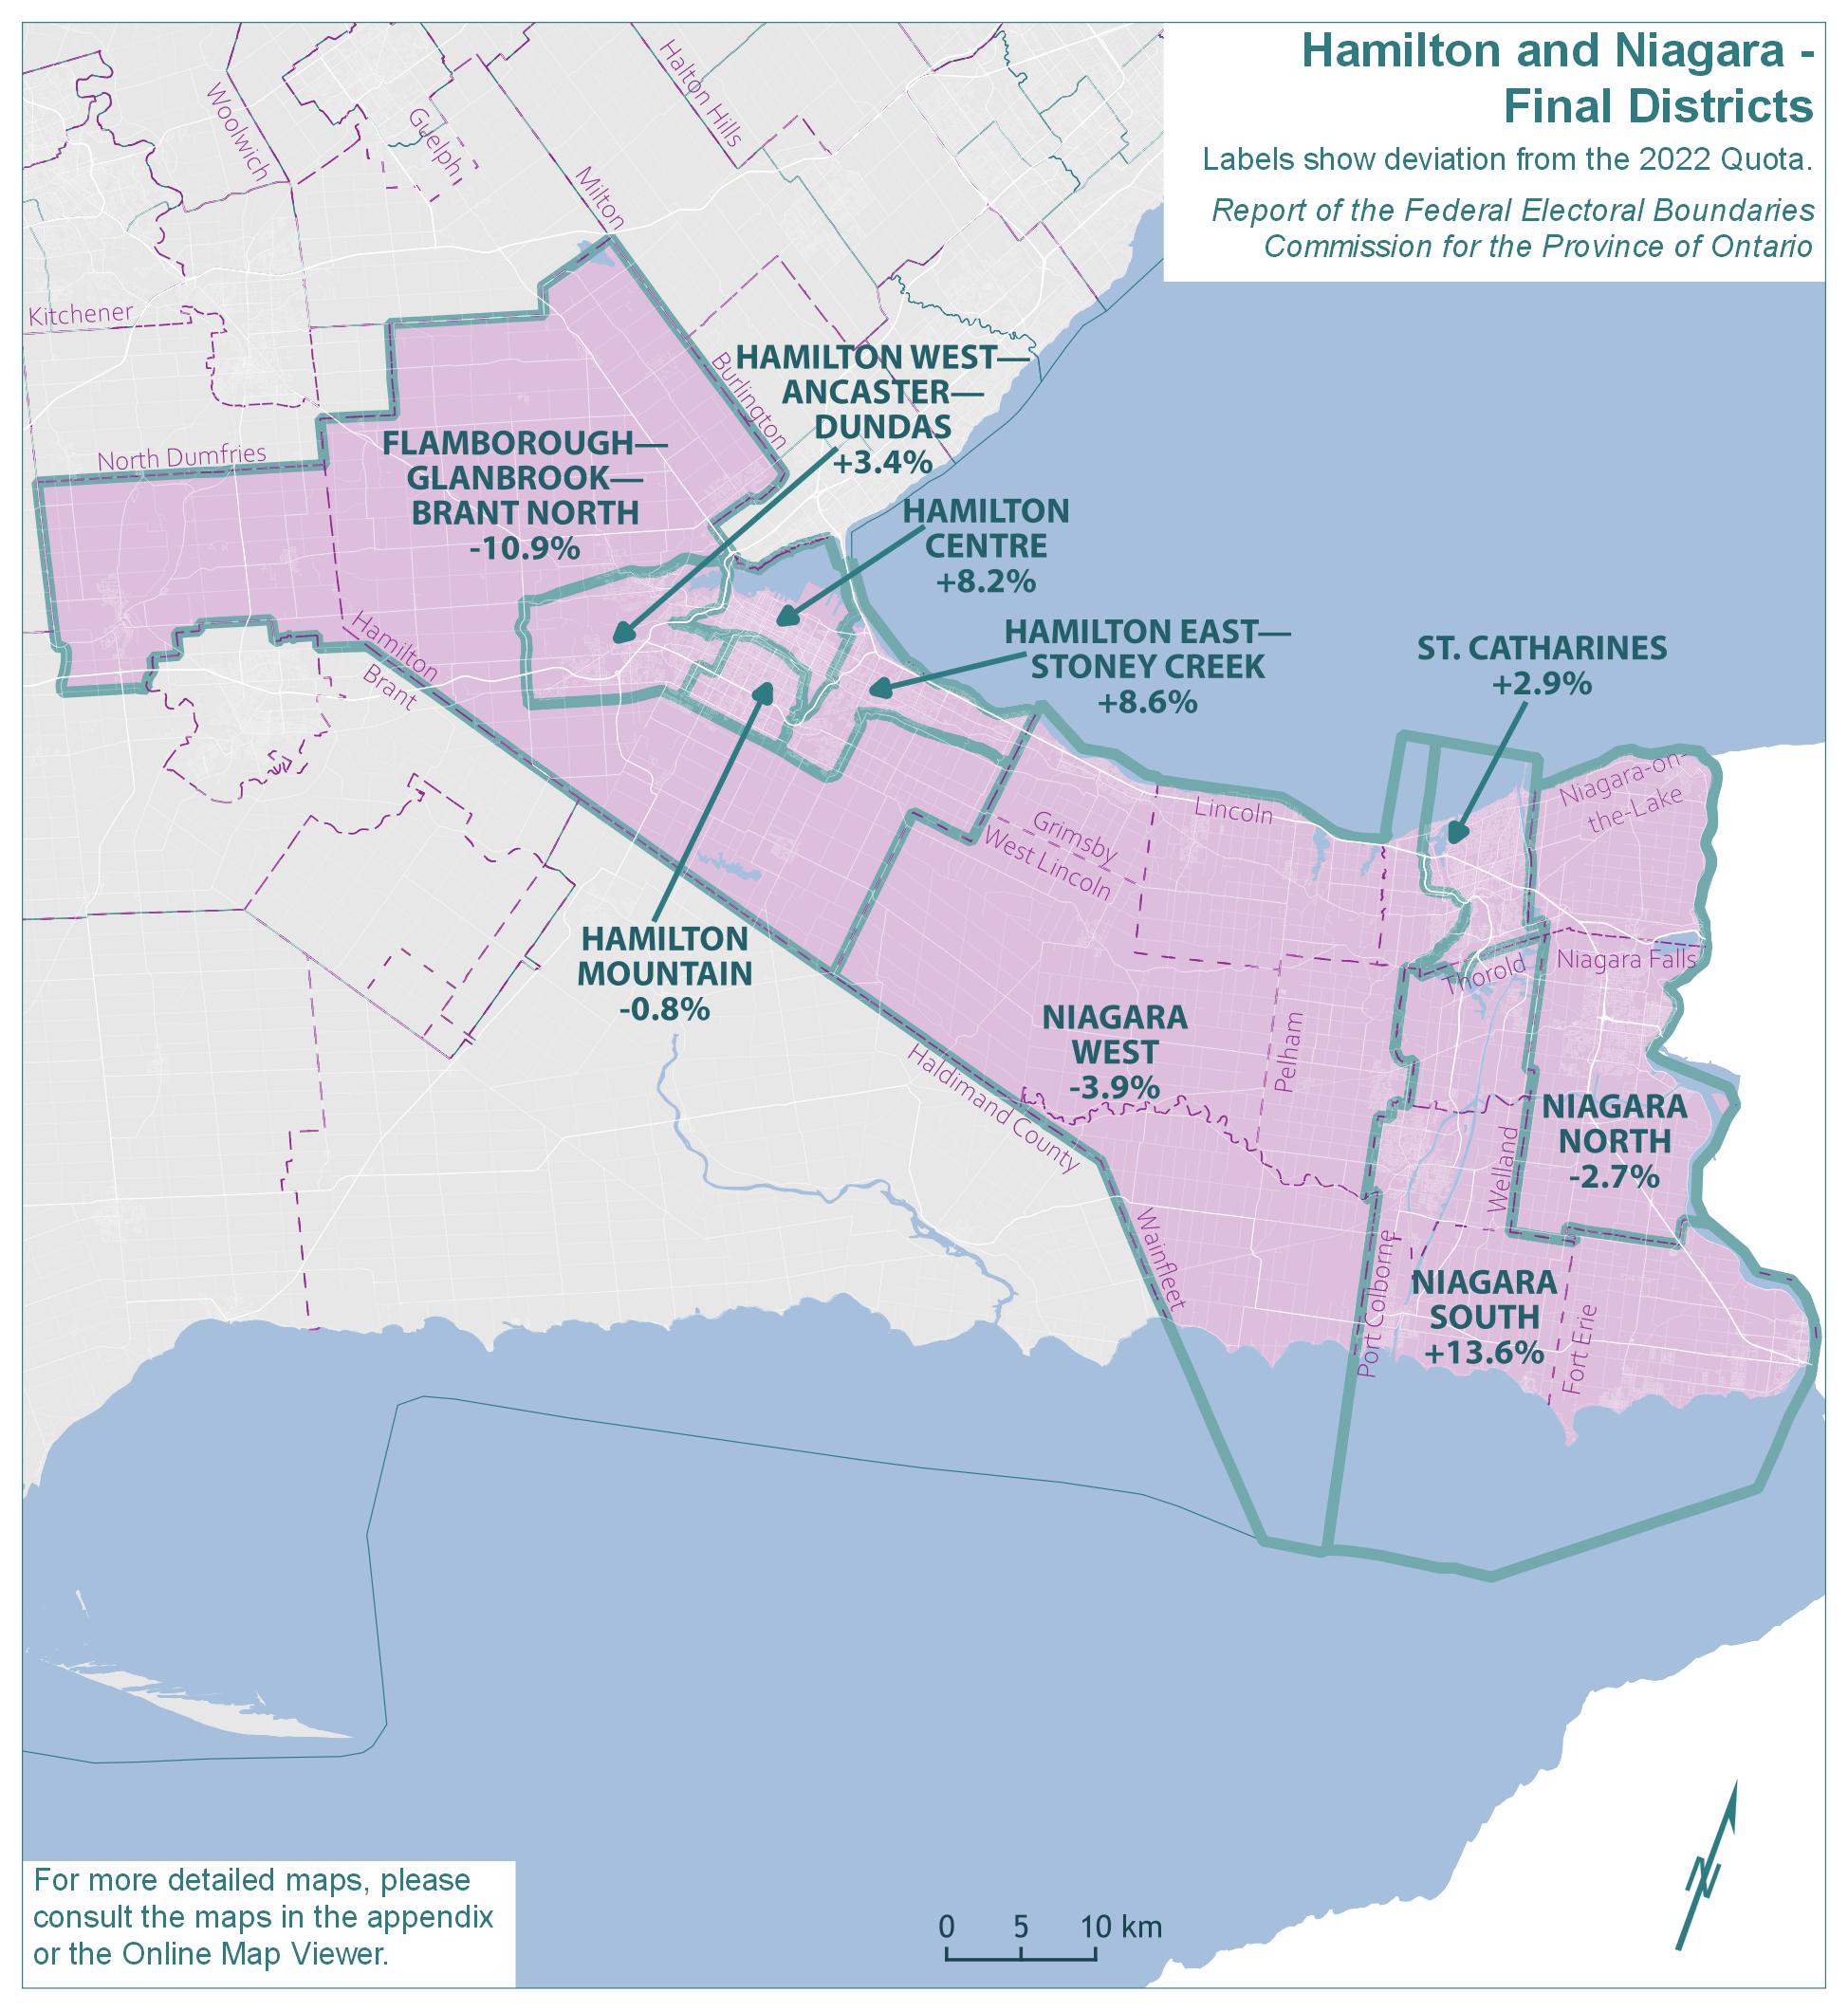
Text version of "Hamilton and Niagara - Final Districts"
Labels show deviation from the 2022 Quota.
Report of the Federal Electoral Boundaries Commission for the Province of Ontario
For more detailed maps, please consult the maps in the appendix or the Online Map Viewer.
| Electoral district | Deviation |
|---|---|
| Flamborough—Glanbrook—Brant North | -10.9% |
| Hamilton Centre | 8.2% |
| Hamilton East—Stoney Creek | 8.6% |
| Hamilton Mountain | -0.8% |
| Hamilton West—Ancaster—Dundas | 3.4% |
| Niagara North | -2.7% |
| Niagara South | 13.6% |
| Niagara West | -3.9% |
| St. Catharines | 2.9% |
The population of Hamilton and Niagara grew by 10.1%, from 951,295 in 2011 to 1,047,294 in 2021. The remainder of Ontario grew by 10.7% in the same period.
The existing nine electoral districts in this geographic piece would have an average 2021 population of 116,366, which falls just 0.2% below the Quota. However, the Commission noted the unacceptably high range of deviation (42.4 percentage points) between the least and most populous districts. The populations and deviations from the Quota for the existing districts are shown in Table 12A.
| Electoral Districts | Population – 2011 | Deviation from Quota – 2012 | Population – 2021 | Deviation from Quota – 2022 |
|---|---|---|---|---|
| Flamborough—Glanbrook | 97,081 | -8.60% | 125,692 | +7.81% |
| Hamilton Centre | 101,932 | -4.03% | 106,439 | -8.71% |
| Hamilton East—Stoney Creek | 107,786 | +1.48% | 112,028 | -3.91% |
| Hamilton Mountain | 103,615 | -2.45% | 107,629 | -7.69% |
| Hamilton West—Ancaster—Dundas | 109,535 | +3.13% | 117,565 | +0.84% |
| Niagara Centre | 105,860 | -0.33% | 119,809 | +2.76% |
| Niagara Falls | 128,357 | +20.85% | 146,404 | +25.57% |
| Niagara West | 86,533 | -18.53% | 96,946 | -16.85% |
| St. Catharines | 110,596 | +4.13% | 114,782 | -1.55% |
| Average | 105,699 | -0.48% | 116,366 | -0.19% |
| Range (most populous to least populous) | 41,824 | 39.38 pp | 49,458 | 42.42 pp |
pp = percentage points
In preparing the proposed redistribution plan, the Commission noted unreasonable variations in the population size of the existing districts of Niagara Falls and Niagara West. Significant adjustments were required to achieve population equality, with resulting impacts on contiguous areas. The populations and deviations from the Quota for the proposed districts are shown in Table 12B.
| Electoral Districts | Population – 2021 | Deviation from Quota – 2022 |
|---|---|---|
| Flamborough—Glanbrook | 114,701 | -1.62% |
| Hamilton Centre | 123,520 | +5.94% |
| Hamilton Mountain | 115,634 | -0.82% |
| Hamilton—Stoney Creek—Grimsby Lakeshore | 121,709 | +4.39% |
| Hamilton West—Ancaster—Dundas | 120,551 | +3.40% |
| Niagara Falls | 113,503 | -2.65% |
| Niagara South | 112,928 | -3.14% |
| Niagara West | 118,158 | +1.34% |
| St. Catharines | 119,873 | +2.82% |
| Average | 117,842 | +1.07% |
| Range (most populous to least populous) | 10,592 | 9.08 pp |
pp = percentage points
There was support for the Commission's proposal to place Niagara Falls and Niagara-on-the-Lake together in the same district. It was suggested that this riding be renamed Niagara North. The Commission agreed that this suggested name was a more inclusive descriptor.
The Commission received many submissions to recognize the advocacy, collaboration, connectivity and synergy of the Welland Canal communities and that Welland, Thorold (which the Commission had proposed be part of Niagara West), Port Colborne and Fort Erie should be placed together in Niagara South. It was stated that the importance of the Welland Canal to the community identity of Thorold, both historically since Confederation and currently, cannot be underestimated. The Commission concluded that the demonstrated north/south economic development resulting from the canal communities' aligned representation should be preserved. Thus, these suggestions were implemented.
There was a submission from an elected representative to include Fort Erie within the newly renamed Niagara North riding, however such an inclusion created an unreasonably large deviation from Quota and other submissions supported the placement of Fort Erie with the other canal communities.
While the Commission received submissions in support of the proposed boundaries for the district of St. Catharines, it was suggested that the neighbourhood of Western Hill be returned to the district. However, this would result in an unreasonably large disparity between the variances of the adjacent districts of St. Catharines and Niagara West. The proposal to shift Western Hill into Niagara West is thus maintained.
The Commission also received submissions to keep Brock University within a single district. The southern boundary of the St. Catharines district has therefore been adjusted to include all of the Brock University campus, as it was clear that the orientation of the University was toward this district and to the City of St. Catharines.
In Niagara West, several people raised objections to the inclusion of Thorold and Dunnville into this district. It was argued that Thorold's industrial and urban nature made it a better fit with the Welland Canal communities rather than the rural and agricultural communities in Niagara West. Arguments were also made that the interests of Dunnville are better aligned with other communities along the Grand River than with those of Niagara West, and that the boundary between Haldimand County and the Township of Wainfleet should be respected as much as possible. The Commission found these arguments persuasive and acceded to both requests.
The Commission also accepted the many submissions that portions of the Town of Grimsby not be divided as proposed. Many of these submissions, including one from the Mayor of Grimsby, pointed out the strong ties of identity and history between Grimsby and the Niagara region. All of Grimsby is now retained in the existing district of Niagara West.
In the Hamilton area, the Commission's proposal had made minor boundary adjustments to achieve voter parity. These changes, other than including portions of Grimsby within the proposed district of Hamilton—Stoney Creek—Grimsby Lakeshore were generally supported.
With the removal of Grimsby, the district is returned to the name Hamilton East—Stoney Creek. Given the need to gain more population, the southern boundary of this district is shifted further south to the powerline. Specifically, the area that lies between the powerline and the edge of the escarpment, bounded on the west by Glover Road and on the east by Upper Centennial Parkway is added to Hamilton East—Stoney Creek. This added area (taken from the more rural district of Flamborough—Glanbrook) is relatively suburban and urban in character, and its population demographics are fairly similar to those of Hamilton East—Stoney Creek.
While these adjustments respect the Town of Grimsby's alignment to the Niagara Region rather than to the City of Hamilton, they in turn create a need to gain additional population for the district of Flamborough—Glanbrook. To solve this problem, and to respond to a series of objections to the Commission's proposal impacting the counties of Brant and Oxford, the boundaries of the existing district of Flamborough—Glanbrook are extended west to the Brant-Oxford County Line, encompassing the communities of Paris and St. George. This district is renamed Flamborough—Glanbrook—Brant North. The discussion of Paris, St. George, and the remainder of Brant County is continued in the South Central Ontario section.
The Commission recognizes that this is a relatively significant set of changes to make after the proposal phase, however these adjustments best respond to the legitimate concerns made in submissions regarding the Hamilton and Niagara region.
Hamilton—Mountain and Hamilton West—Ancaster—Dundas have received no changes since the proposal. Hamilton Centre has received one modification. The boundary with Hamilton East—Stoney Creek on Walter Avenue and Strathearne Avenue has been moved to Parkdale Avenue, making for a simple, clear boundary.
The resulting deviations are wider than the Commission had originally proposed; however, the submissions to make the changes described were compelling. The submissions demonstrated that effective representation required these deviations from absolute voter parity.
The names, populations and deviations from the Quota for Hamilton and Niagara's final districts are shown in Table 12C.
| Electoral Districts | Population – 2021 | Deviation from Quota – 2022 |
|---|---|---|
| Flamborough—Glanbrook—Brant North | 103,836 | -10.94% |
| Hamilton Centre | 126,188 | +8.23% |
| Hamilton East—Stoney Creek | 126,570 | +8.56% |
| Hamilton Mountain | 115,634 | -0.82% |
| Hamilton West—Ancaster—Dundas | 120,551 | +3.40% |
| Niagara North | 113,503 | -2.65% |
| Niagara South | 132,396 | +13.56% |
| Niagara West | 112,065 | -3.88% |
| St. Catharines | 119,977 | +2.91% |
| Average | 118,969 | +2.04% |
| Range (most populous to least populous) | 28,560 | 24.50 pp |
pp = percentage points
South Central Ontario
South Central Ontario - Existing Districts
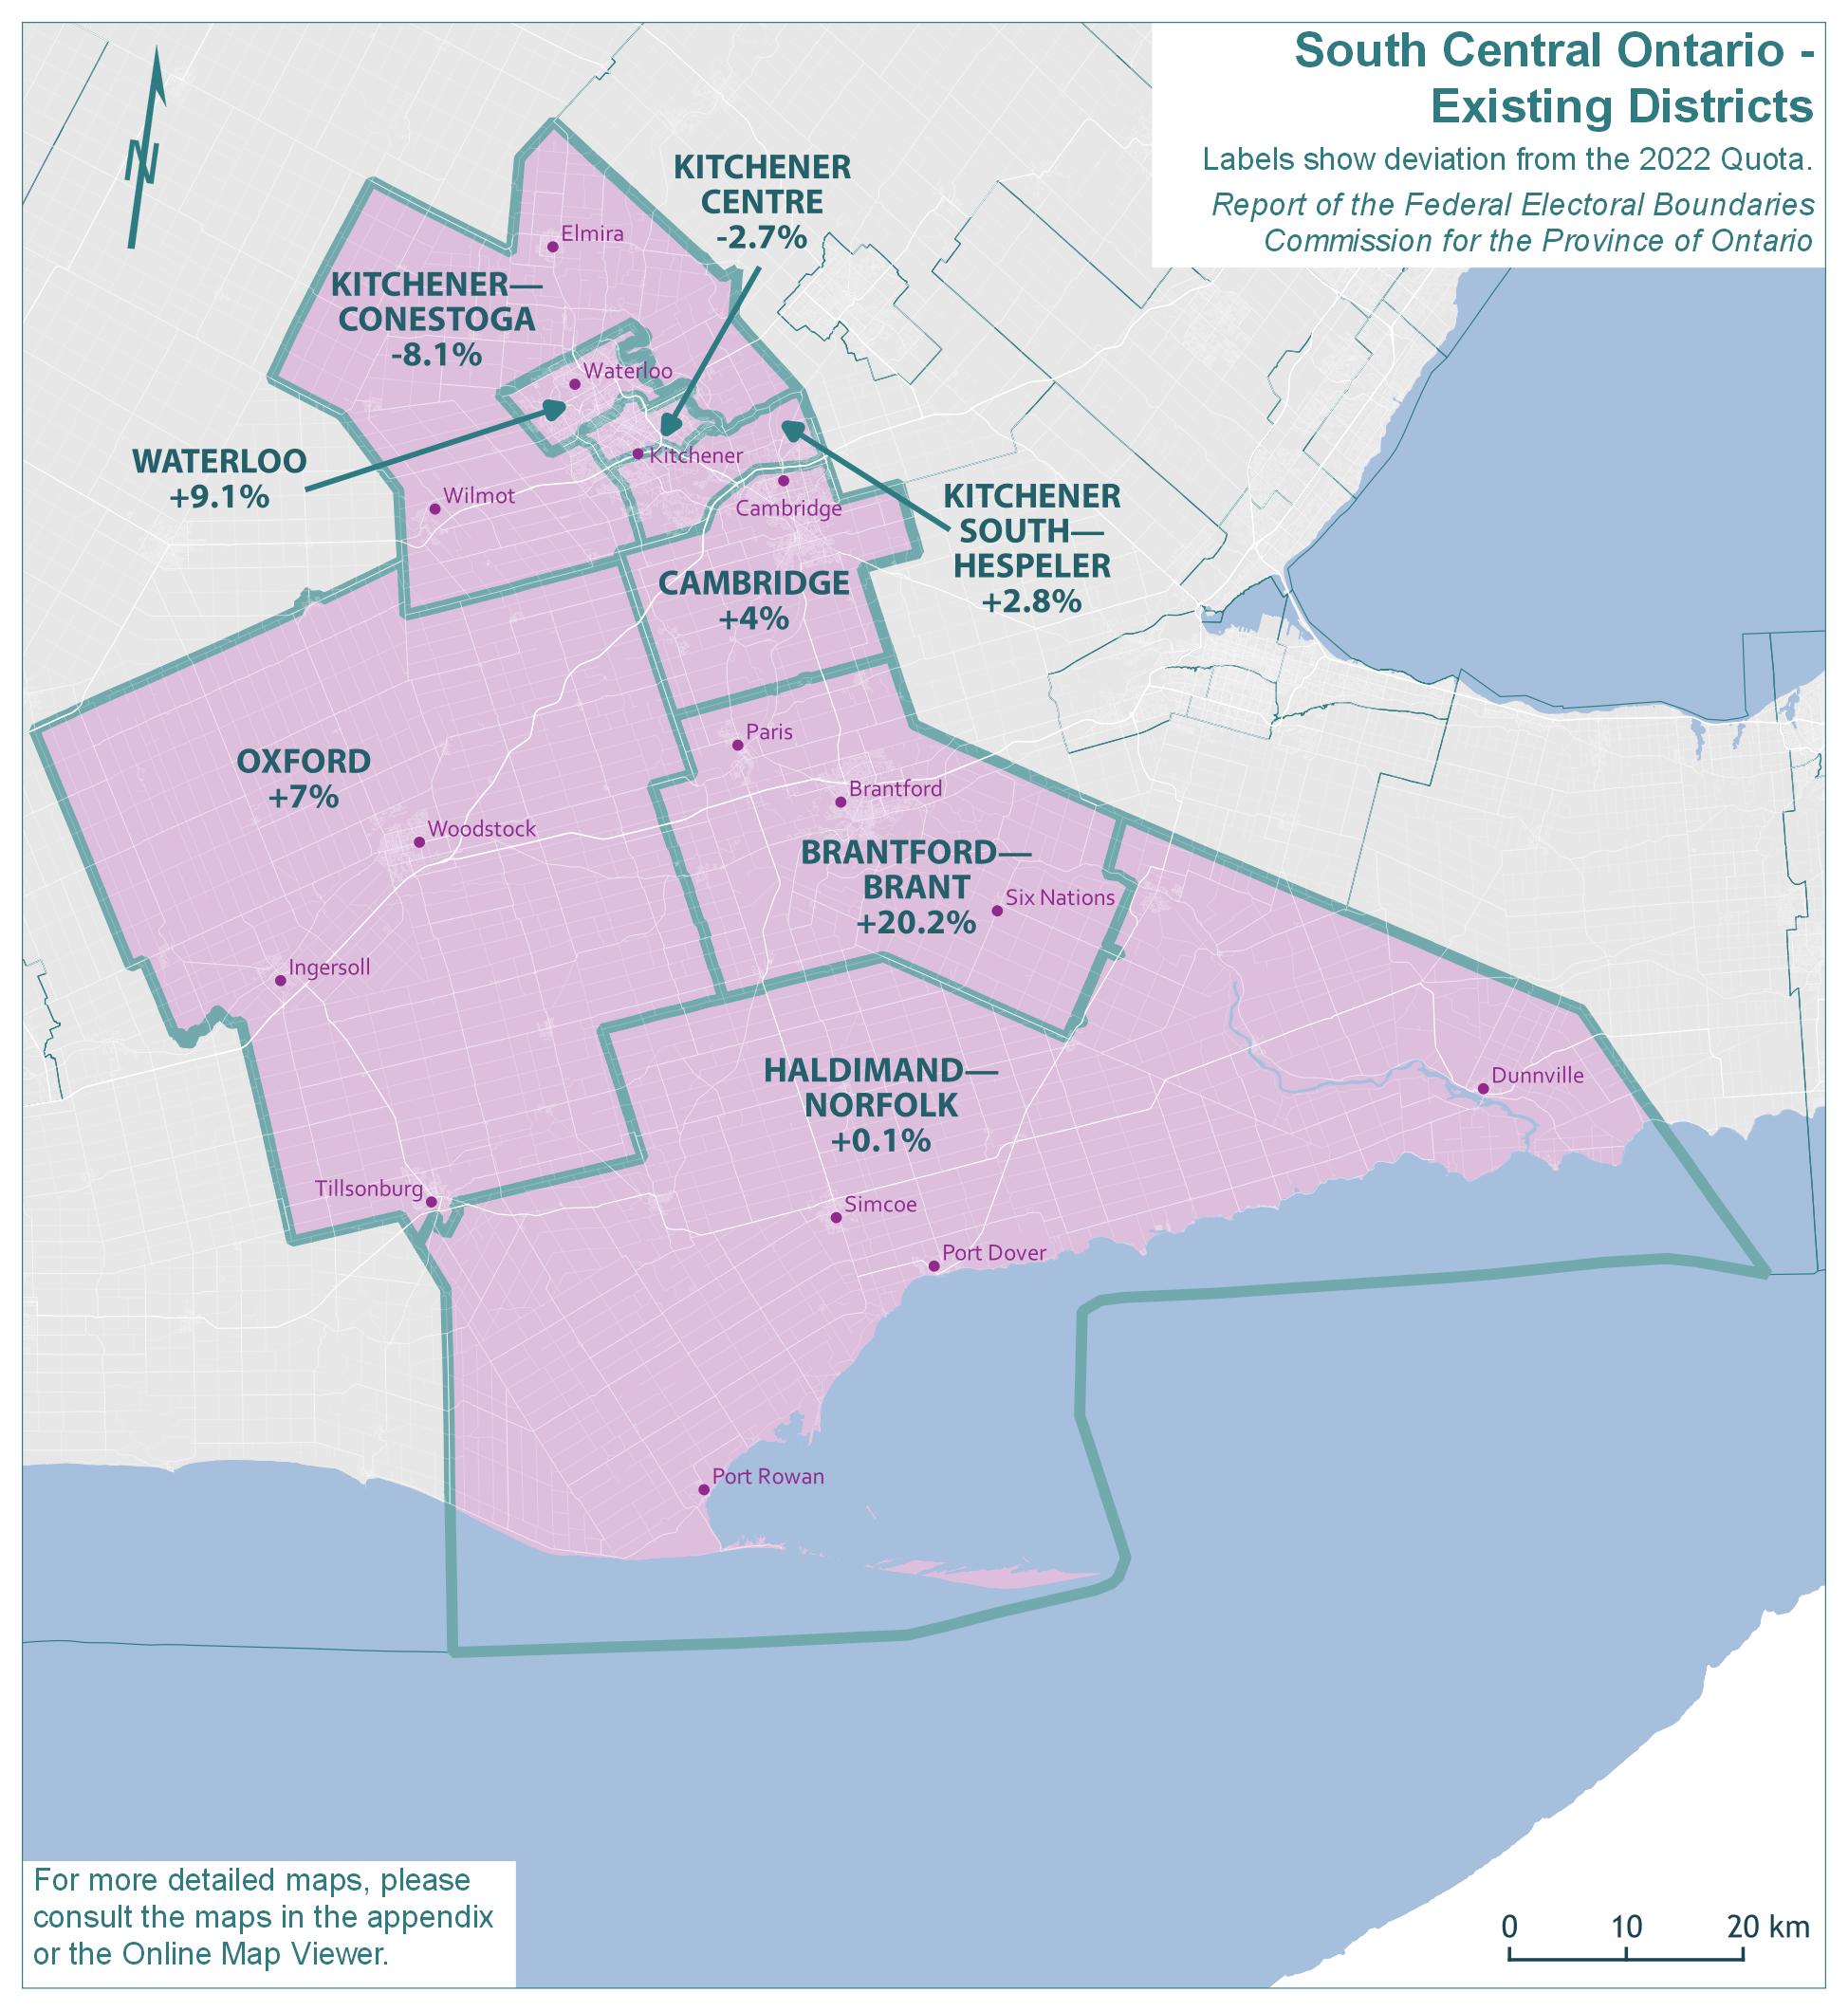
Text version of "South Central Ontario - Existing Districts"
Labels show deviation from the 2022 Quota.
Report of the Federal Electoral Boundaries Commission for the Province of Ontario
For more detailed maps, please consult the maps in the appendix or the Online Map Viewer.
| Electoral district | Deviation |
|---|---|
| Brantford—Brant | 20.2% |
| Cambridge | 4.0% |
| Haldimand—Norfolk | 0.1% |
| Kitchener Centre | -2.7% |
| Kitchener South—Hespeler | 2.8% |
| Kitchener—Conestoga | -8.1% |
| Oxford | 7.0% |
| Waterloo | 9.1% |
South Central Ontario - Proposed Districts

Text version of "South Central Ontario - Proposed Districts"
Labels show deviation from the 2022 Quota.
Report of the Federal Electoral Boundaries Commission for the Province of Ontario
For more detailed maps, please consult the maps in the appendix or the Online Map Viewer.
| Electoral district | Deviation |
|---|---|
| Brantford | 1.4% |
| Cambridge | 4.7% |
| Haldimand—Norfolk—Six Nations | 5.3% |
| Kitchener Centre | -1.7% |
| Kitchener—Conestoga | -1.5% |
| Kitchener South—North Dumfries | -2.1% |
| Oxford—Brant | 7.1% |
| Waterloo | 4.2% |
South Central Ontario - Final Districts
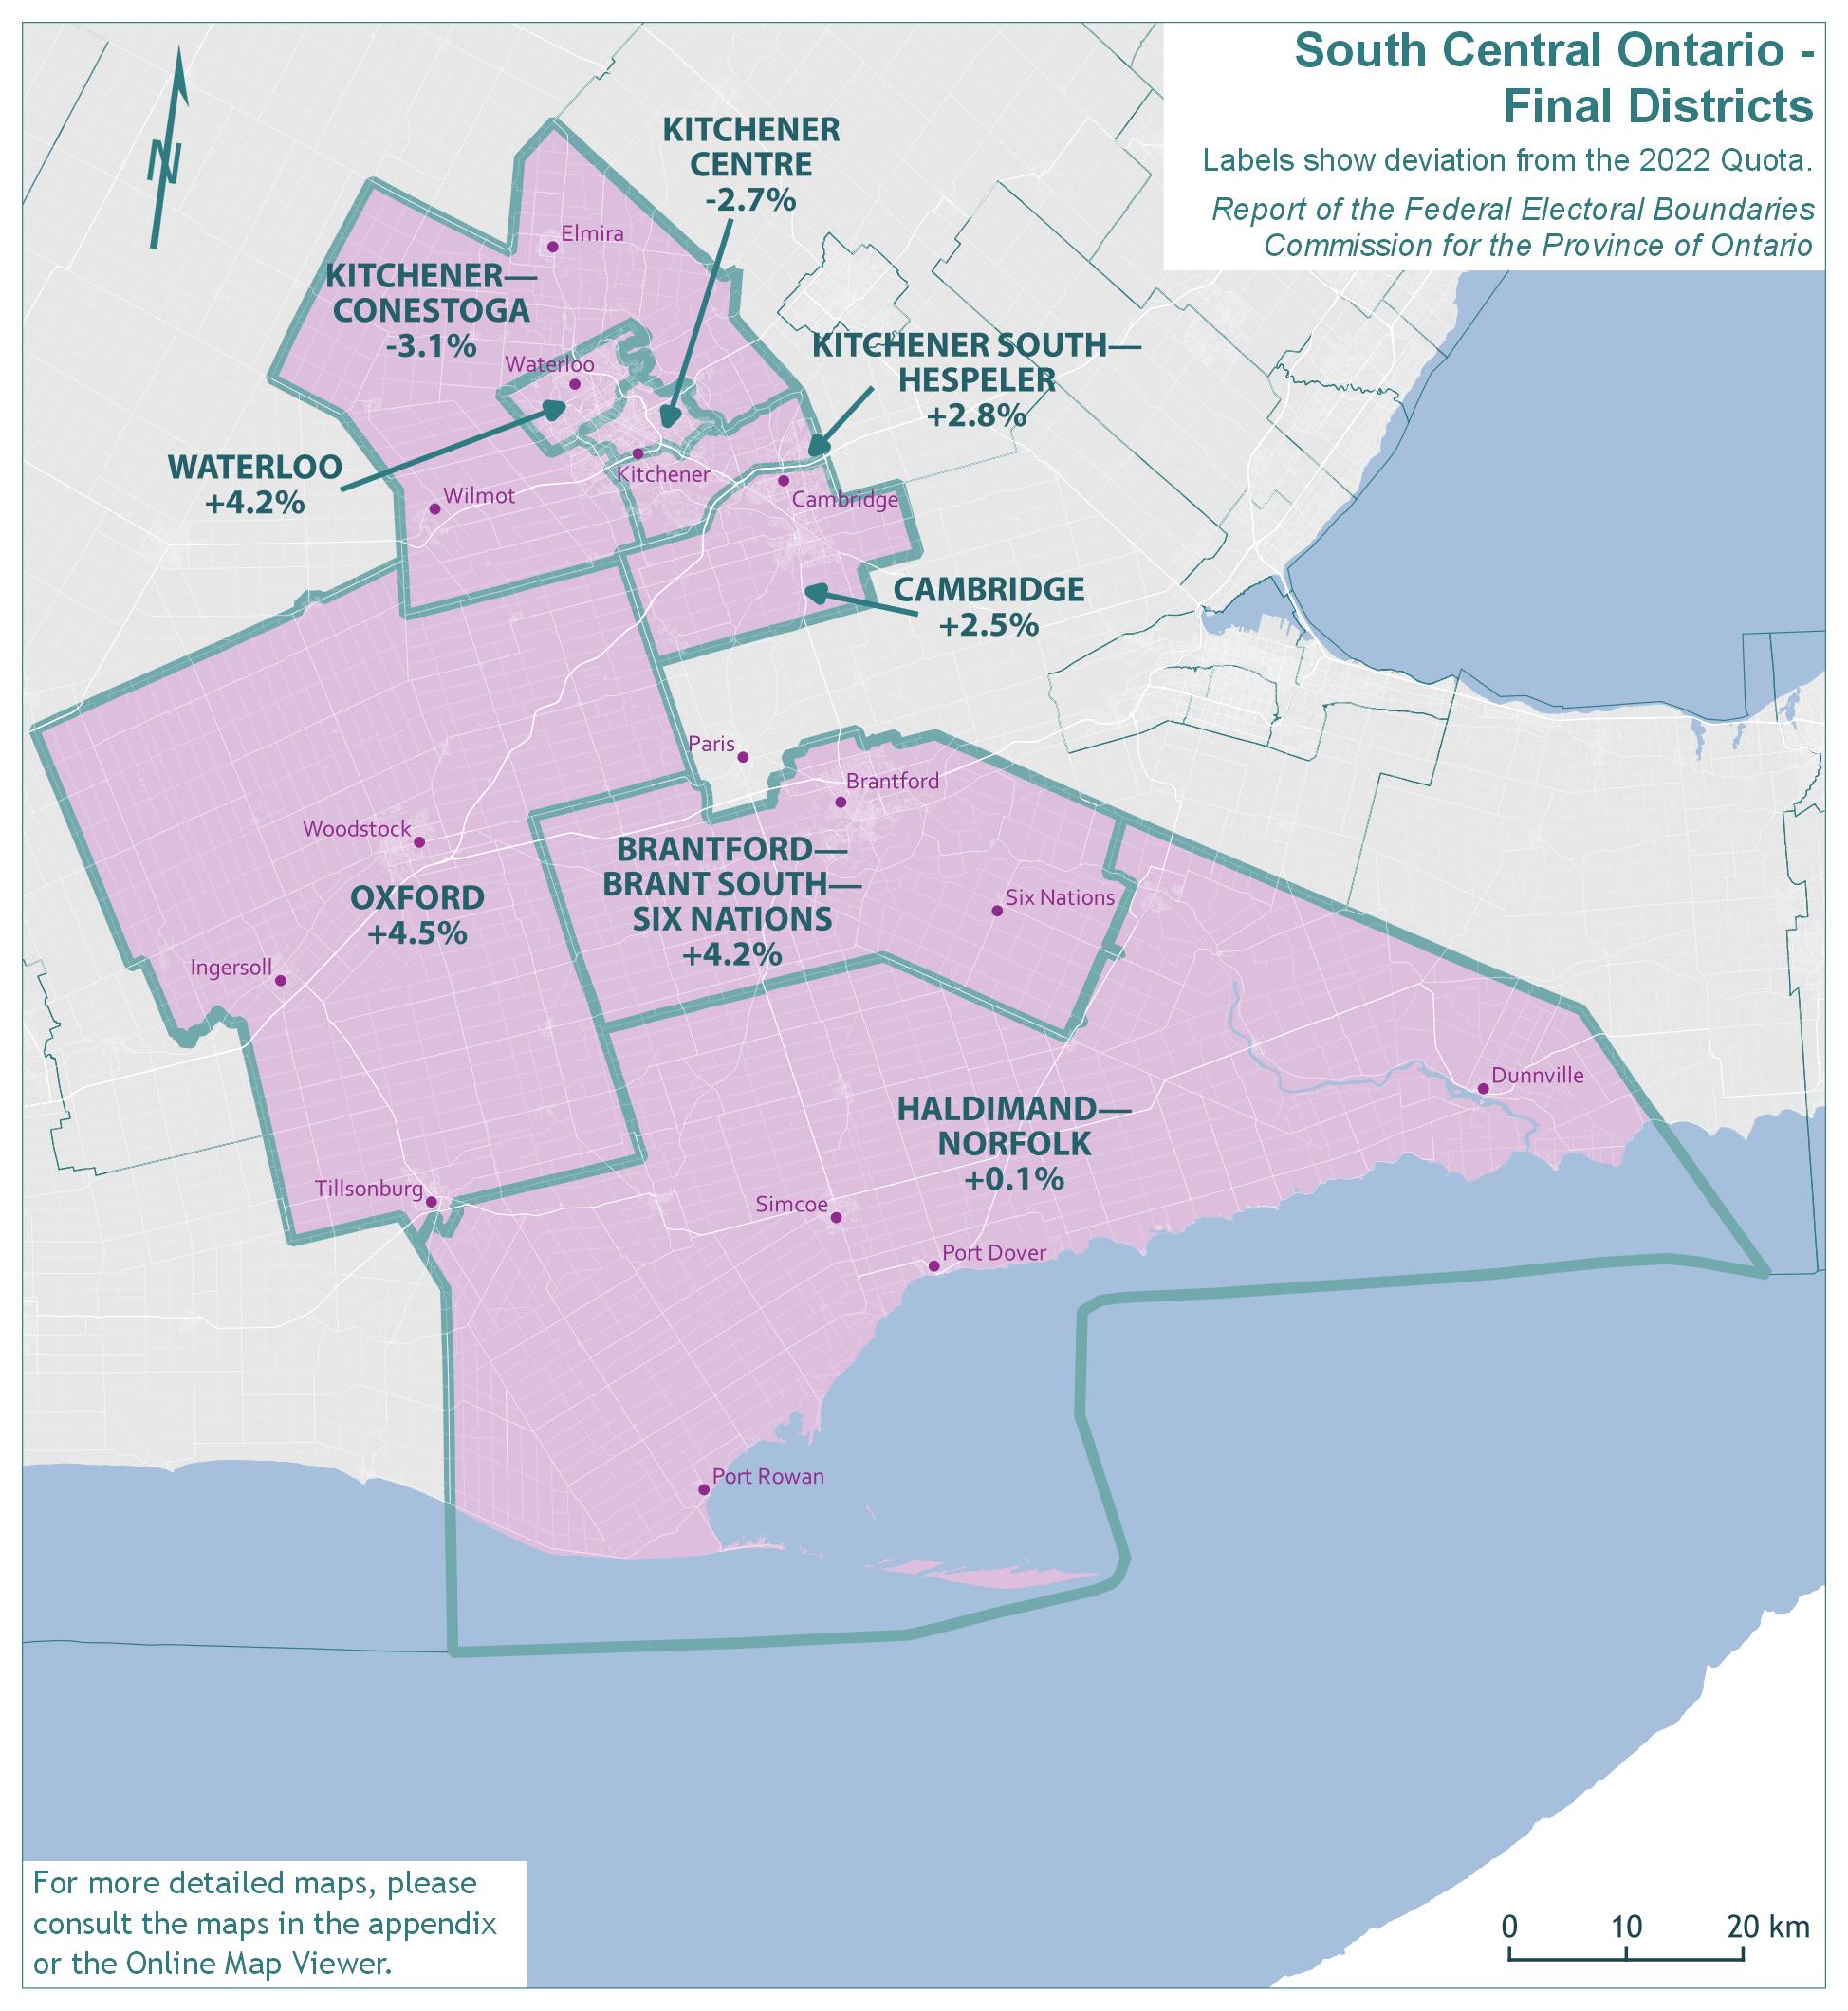
Text version of "South Central Ontario - Final Districts"
Labels show deviation from the 2022 Quota.
Report of the Federal Electoral Boundaries Commission for the Province of Ontario
For more detailed maps, please consult the maps in the appendix or the Online Map Viewer.
| Electoral district | Deviation |
|---|---|
| Brantford—Brant South—Six Nations | 4.2% |
| Cambridge | 2.5% |
| Haldimand—Norfolk | 0.1% |
| Kitchener Centre | -2.7% |
| Kitchener South—Hespeler | 2.8% |
| Kitchener—Conestoga | -3.1% |
| Oxford | 4.5% |
| Waterloo | 4.2% |
The population of South Central Ontario grew by 13.1%, from 857,968 in 2011 to 970,608 in 2021. The remainder of Ontario grew by 10.5% in the same period.
The existing eight electoral districts in South Central Ontario would have an average 2021 population of 121,326 and an average deviation of 4.1% from the Quota. The absolute range between the least and most populous districts would be 28.3 percentage points. The populations and deviations from the Quota for the existing electoral districts are shown in Table 13A.
| Electoral Districts | Population – 2011 | Deviation from Quota – 2012 | Population – 2021 | Deviation from Quota – 2022 |
|---|---|---|---|---|
| Brantford—Brant | 132,443 | +24.69% | 140,139 | +20.20% |
| Cambridge | 111,693 | +5.16% | 121,301 | +4.04% |
| Haldimand—Norfolk | 108,051 | +1.73% | 116,706 | +0.10% |
| Kitchener Centre | 102,433 | -3.56% | 113,452 | -2.69% |
| Kitchener—Conestoga | 93,827 | -11.66% | 107,134 | -8.11% |
| Kitchener South—Hespeler | 97,673 | -8.04% | 119,851 | +2.80% |
| Oxford | 108,656 | +2.30% | 124,790 | +7.03% |
| Waterloo | 103,192 | -2.85% | 127,235 | +9.13% |
| Average | 107,246 | +0.97% | 121,326 | +4.06% |
| Range (most populous to least populous) | 38,616 | 36.35 pp | 33,005 | 28.31 pp |
pp = percentage points
In preparing the proposed redistribution plan, the Commission noted the significant deviation from the Quota in the prior redistribution in the existing district of Brantford—Brant. A reduced geographic size of this district was thus proposed in order to balance populations. This resulted in several communities in this area being re-assigned to other districts.
Additionally, in the interest of achieving voter parity, a series of boundary changes was proposed in the districts surrounding Kitchener, Waterloo, and Cambridge. The populations and deviations from the Quota for the proposed districts are shown in Table 13B.
| Electoral Districts | Population – 2021 | Deviation from Quota – 2022 |
|---|---|---|
| Brantford | 118,167 | +1.35% |
| Cambridge | 122,099 | +4.73% |
| Haldimand—Norfolk—Six Nations | 122,813 | +5.34% |
| Kitchener Centre | 114,595 | -1.71% |
| Kitchener—Conestoga | 114,856 | -1.49% |
| Kitchener South—North Dumfries | 114,179 | -2.07% |
| Oxford—Brant | 124,844 | +7.08% |
| Waterloo | 121,436 | +4.16% |
| Average | 119,124 | +2.17% |
| Range (most populous to least populous) | 10,665 | 9.15 pp |
pp = percentage points
Public submissions endorsed some aspects of these proposals. However, there were strong objections to the transfer of several towns into districts that did not align with their county seats. Fortunately, many of these issues could be addressed by a set of more-or-less reciprocal population transfers among districts.
The Commission has revised its proposal in order to keep the boundaries of the district of Oxford aligned with Oxford County boundaries, thus retaining Tillsonburg in the district as requested by the County and the Town of Tillsonburg to maintain their advocacy partnership. The final district of Oxford will be very similar to the existing district of Oxford, with the exceptions of the parts located in the County of Brant which have been added to Brantford—Brant South—Six Nations.
The population of the County of Brant and the City of Brantford are too large to be contained in a single electoral district. The combined populations of Brant and Brantford would have an unreasonably high deviation of 24% above the Quota, so requests to keep this county whole could not be accommodated.
The Commission had proposed to split Brantford and Brant into east and west halves, with the western half (including the communities of Paris, Burford, and Scotland) joining with Oxford County in Oxford—Brant.
The Commission received much feedback from the communities of Burford and Paris. These submissions objected to being removed from the City of Brantford, with which they claim to have strong social and economic ties. They also objected to being added to a district primarily based on Oxford County with a population centre in Woodstock and Ingersoll. Based on this feedback, the Commission has significantly altered the proposed plan for Brantford and the County of Brant.
The Commission has returned Burford to within county lines, restoring it and the remainder of southwestern Brant County to the district of Brantford—Brant South—Six Nations.
However, the population of Paris (at approximately 15,000) is too large to accommodate within that district. It has been shifted, together with the northern portions of Brant County, into the district of Flamborough—Glanbrook—Brant North.
The town of Paris will carry greater demographic weight within this district, compared to the Commission's initial proposal that placed Paris in a district dominated by Oxford County and a population centred in Woodstock.
This solution is also consistent with a submission received from the Council of the County of Brant, which suggested that the Commission examine a north-south split and requested that any split be drawn to match ward boundaries. Wards one, two and three have been placed in Flamborough—Glanbrook—Brant North, while Wards four and five are in Brantford—Brant South—Six Nations.
The proposal had shifted the Six Nations of the Grand River and Mississaugas of the Credit First Nations out of the existing district of Brantford—Brant and into the proposed district of Haldimand—Norfolk—Six Nations. One oversight in this proposal was that the Woodland Cultural Centre (established on the site of the former Mohawk Institute Residential School and serving as a significant cultural heritage centre for the Haudenosaunee people) is situated within the City of Brantford, some distance from the main reserve. Returning the two First Nations to the district of Brantford—Brant South—Six Nations resolves this error. It also better reflects the historical alignment of these communities with the City of Brantford, which we were advised is much stronger than their alignment with Caledonia.
These adjustments facilitate restoring Dunnville to the district of Haldimand—Norfolk, rather than putting it across the county line in the Niagara West district. The Commission had received several submissions about this issue. These modifications return Haldimand—Norfolk to its existing boundaries.
In the Kitchener, Waterloo and Cambridge areas, the Commission heard support for its proposal to transfer the Bridgeport area from the district of Waterloo into Kitchener Centre.
Suggestions were also made to re-join the historically aligned communities of Forest Hills and Forest Heights, which had been divided in the prior redistribution, as well as to return the community of Rosenberg to Kitchener—Conestoga. Both these requests could be satisfied while balancing populations.
The Commission had intended to better unify the various parts of the City of Cambridge; however, through submissions the Commission learned that keeping each of the distinct communities of Cambridge whole was a greater priority. In particular, the Commission heard strong objections to the division of Hespeler. Whereas the proposal endeavoured to reunite most of Hespeler within Cambridge (effectively dissolving the district of Kitchener South—Hespeler), the Commission was told that it made no sense to transfer the established urban portion of Hespeler that lies north of the Mill Pond into the more expansive rural district of Kitchener—Conestoga. Hearing this message repeatedly both from elected representatives and residents of North Hespeler, and from rural residents in various parts of Kitchener—Conestoga, the Commission has heeded this recommendation. To keep Hespeler united, the Commission has thus maintained the district of Kitchener South—Hespeler, which reflects the Commission's retention of the original name, an issue that was raised by elected representatives and many residents.
With Hespeler now fully removed from Cambridge, the Commission can satisfy the request of the Township and residents of North Dumfries to be returned to the district, respecting that it is a key partner community with the City of Cambridge. Whereas the proposal had divided the City of Cambridge across three districts, this has now been reduced to two. The final district of Cambridge is the same as the existing district, with the exception of those areas that were within the County of Brant, which are transferred to Flamborough—Glanbrook—Brant North.
The names, populations and deviations from the Quota for South Central Ontario's final districts are shown in Table 13C.
| Electoral Districts | Population – 2021 | Deviation from Quota – 2022 |
|---|---|---|
| Brantford—Brant South—Six Nations | 121,511 | +4.22% |
| Cambridge | 119,493 | +2.49% |
| Haldimand—Norfolk | 116,706 | +0.10% |
| Kitchener Centre | 113,404 | -2.73% |
| Kitchener—Conestoga | 112,981 | -3.10% |
| Kitchener South—Hespeler | 119,851 | +2.80% |
| Oxford | 121,781 | +4.45% |
| Waterloo | 121,436 | +4.16% |
| Average | 118,395 | +1.55% |
| Range (most populous to least populous) | 8,800 | 7.55 pp |
pp = percentage points
Southwestern Ontario
Southwestern Ontario - Existing Districts
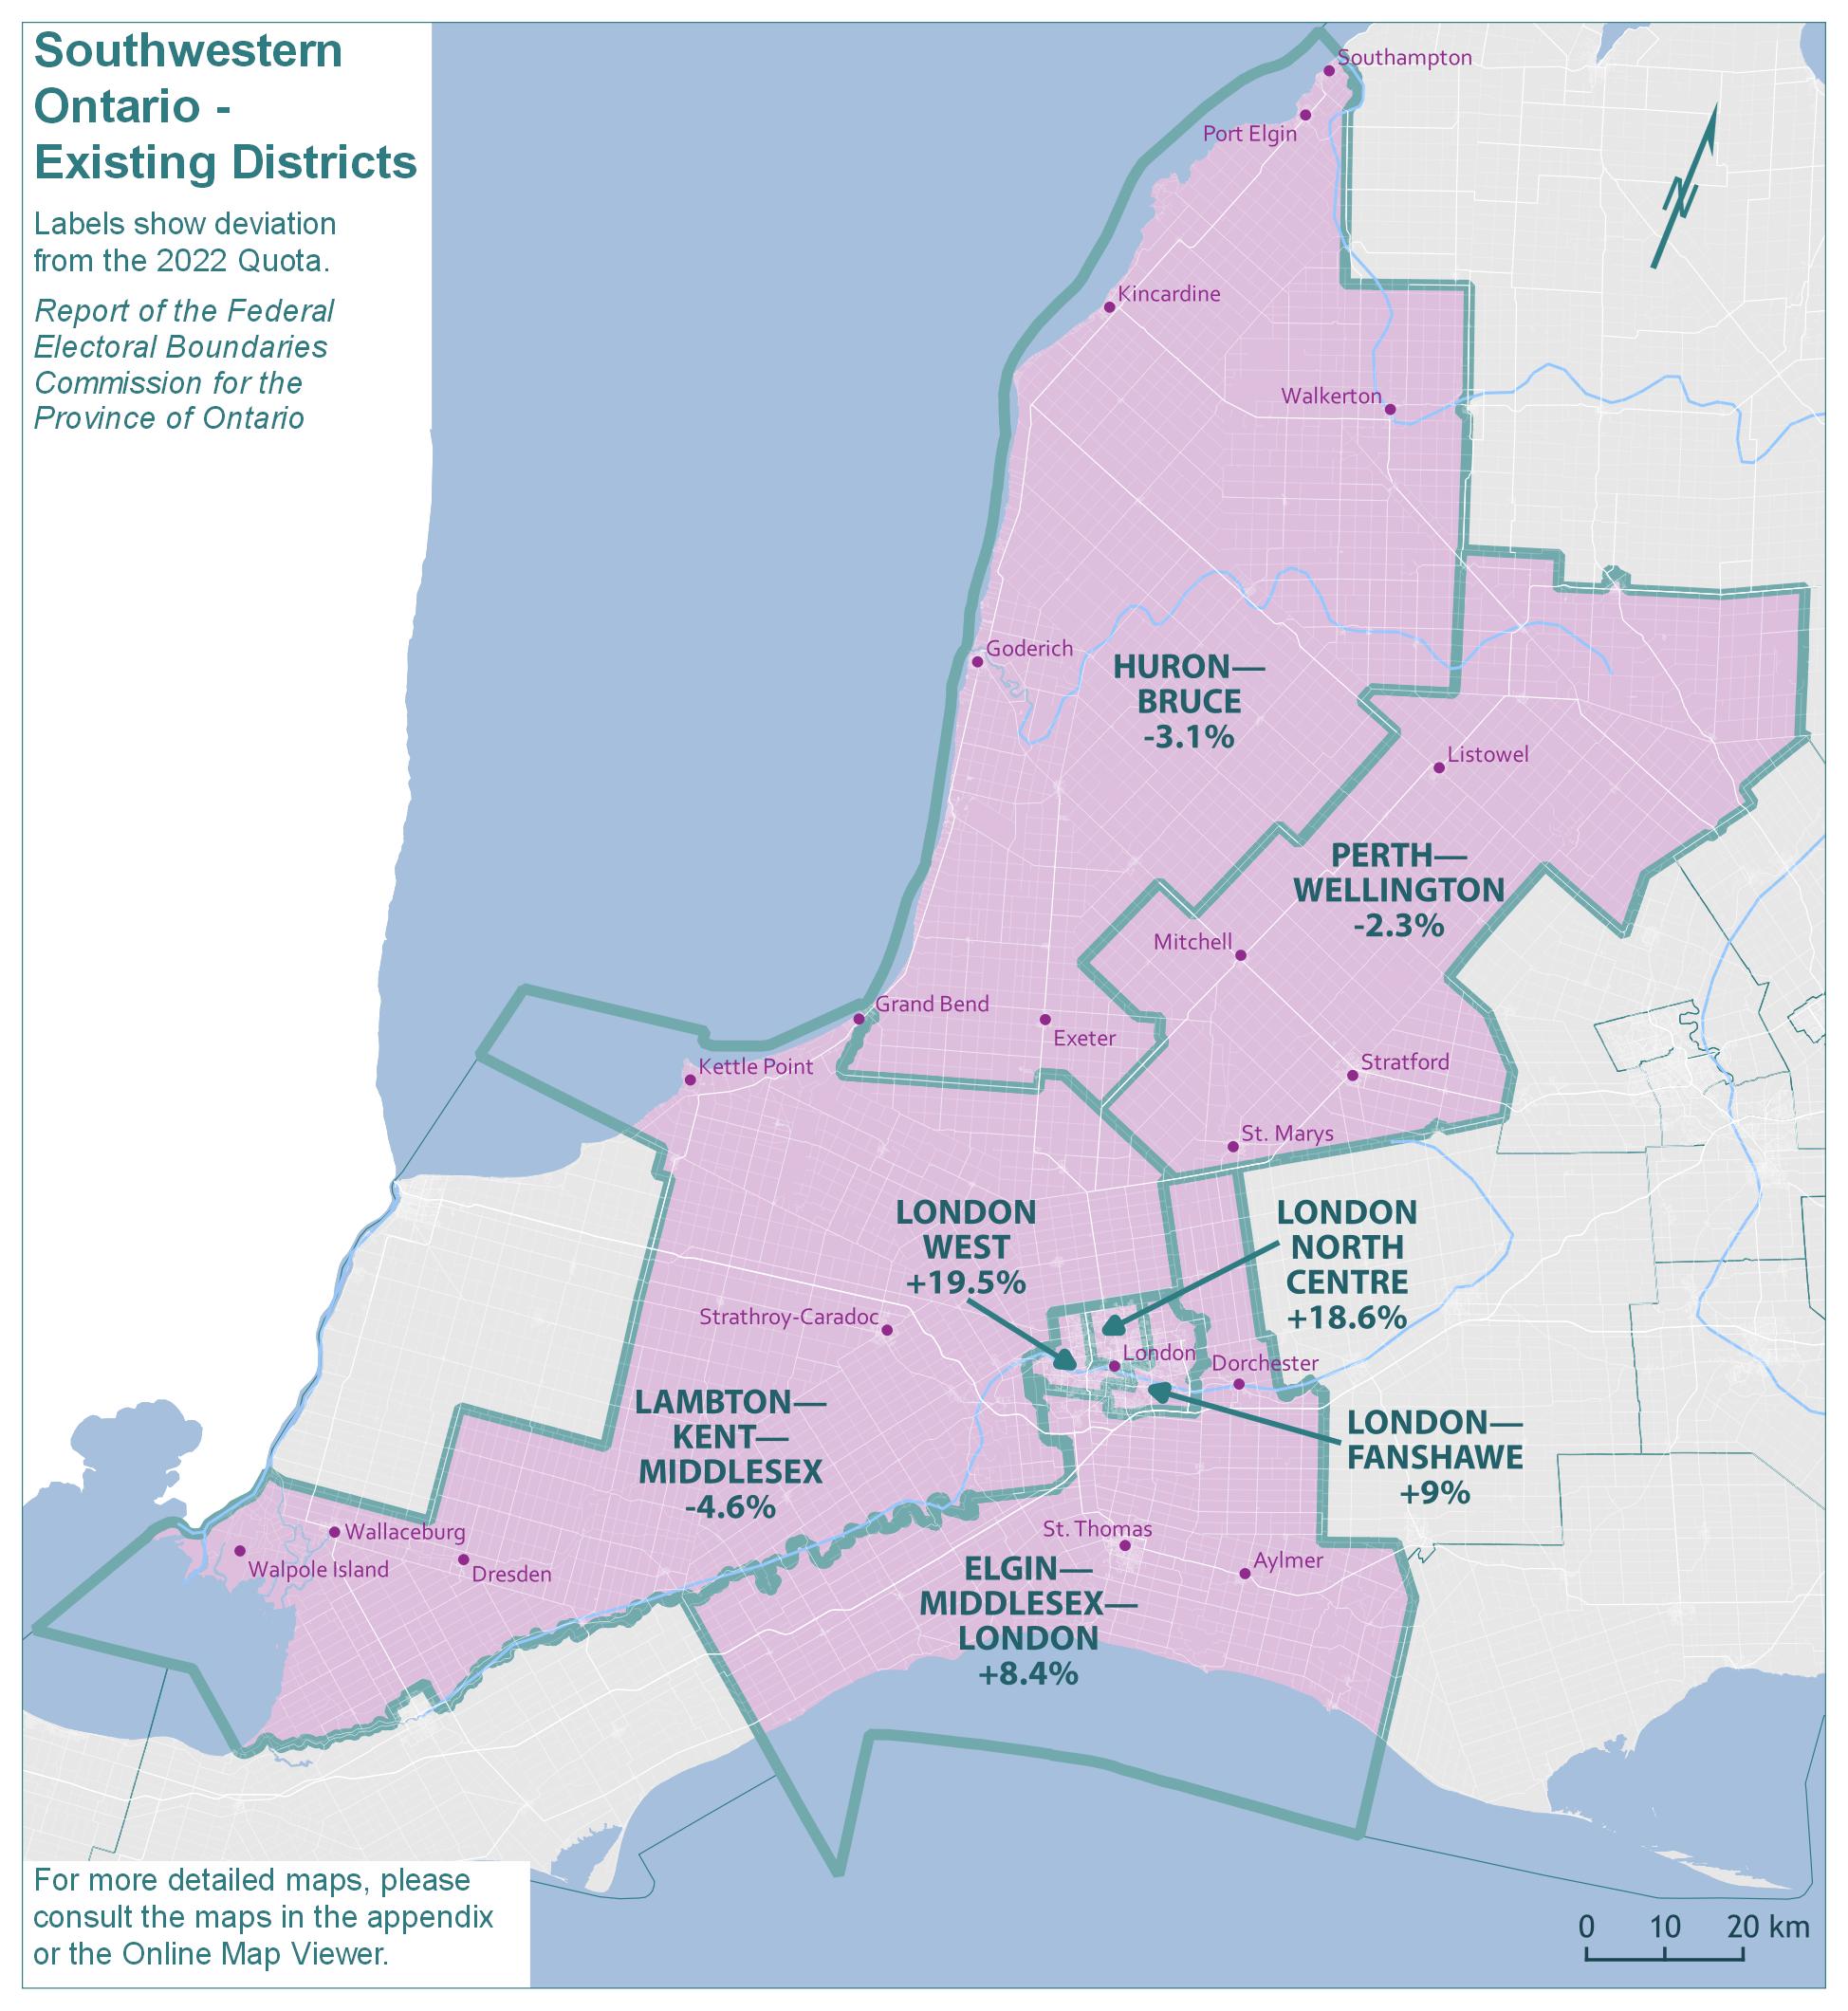
Text version of "Southwestern Ontario - Existing Districts"
Labels show deviation from the 2022 Quota.
Report of the Federal Electoral Boundaries Commission for the Province of Ontario
For more detailed maps, please consult the maps in the appendix or the Online Map Viewer.
| Electoral district | Deviation |
|---|---|
| Elgin—Middlesex—London | 8.4% |
| Huron—Bruce | -3.1% |
| Lambton—Kent—Middlesex | -4.6% |
| London North Centre | 18.6% |
| London West | 19.5% |
| London—Fanshawe | 9.0% |
| Perth—Wellington | -2.3% |
Southwestern Ontario - Proposed Districts
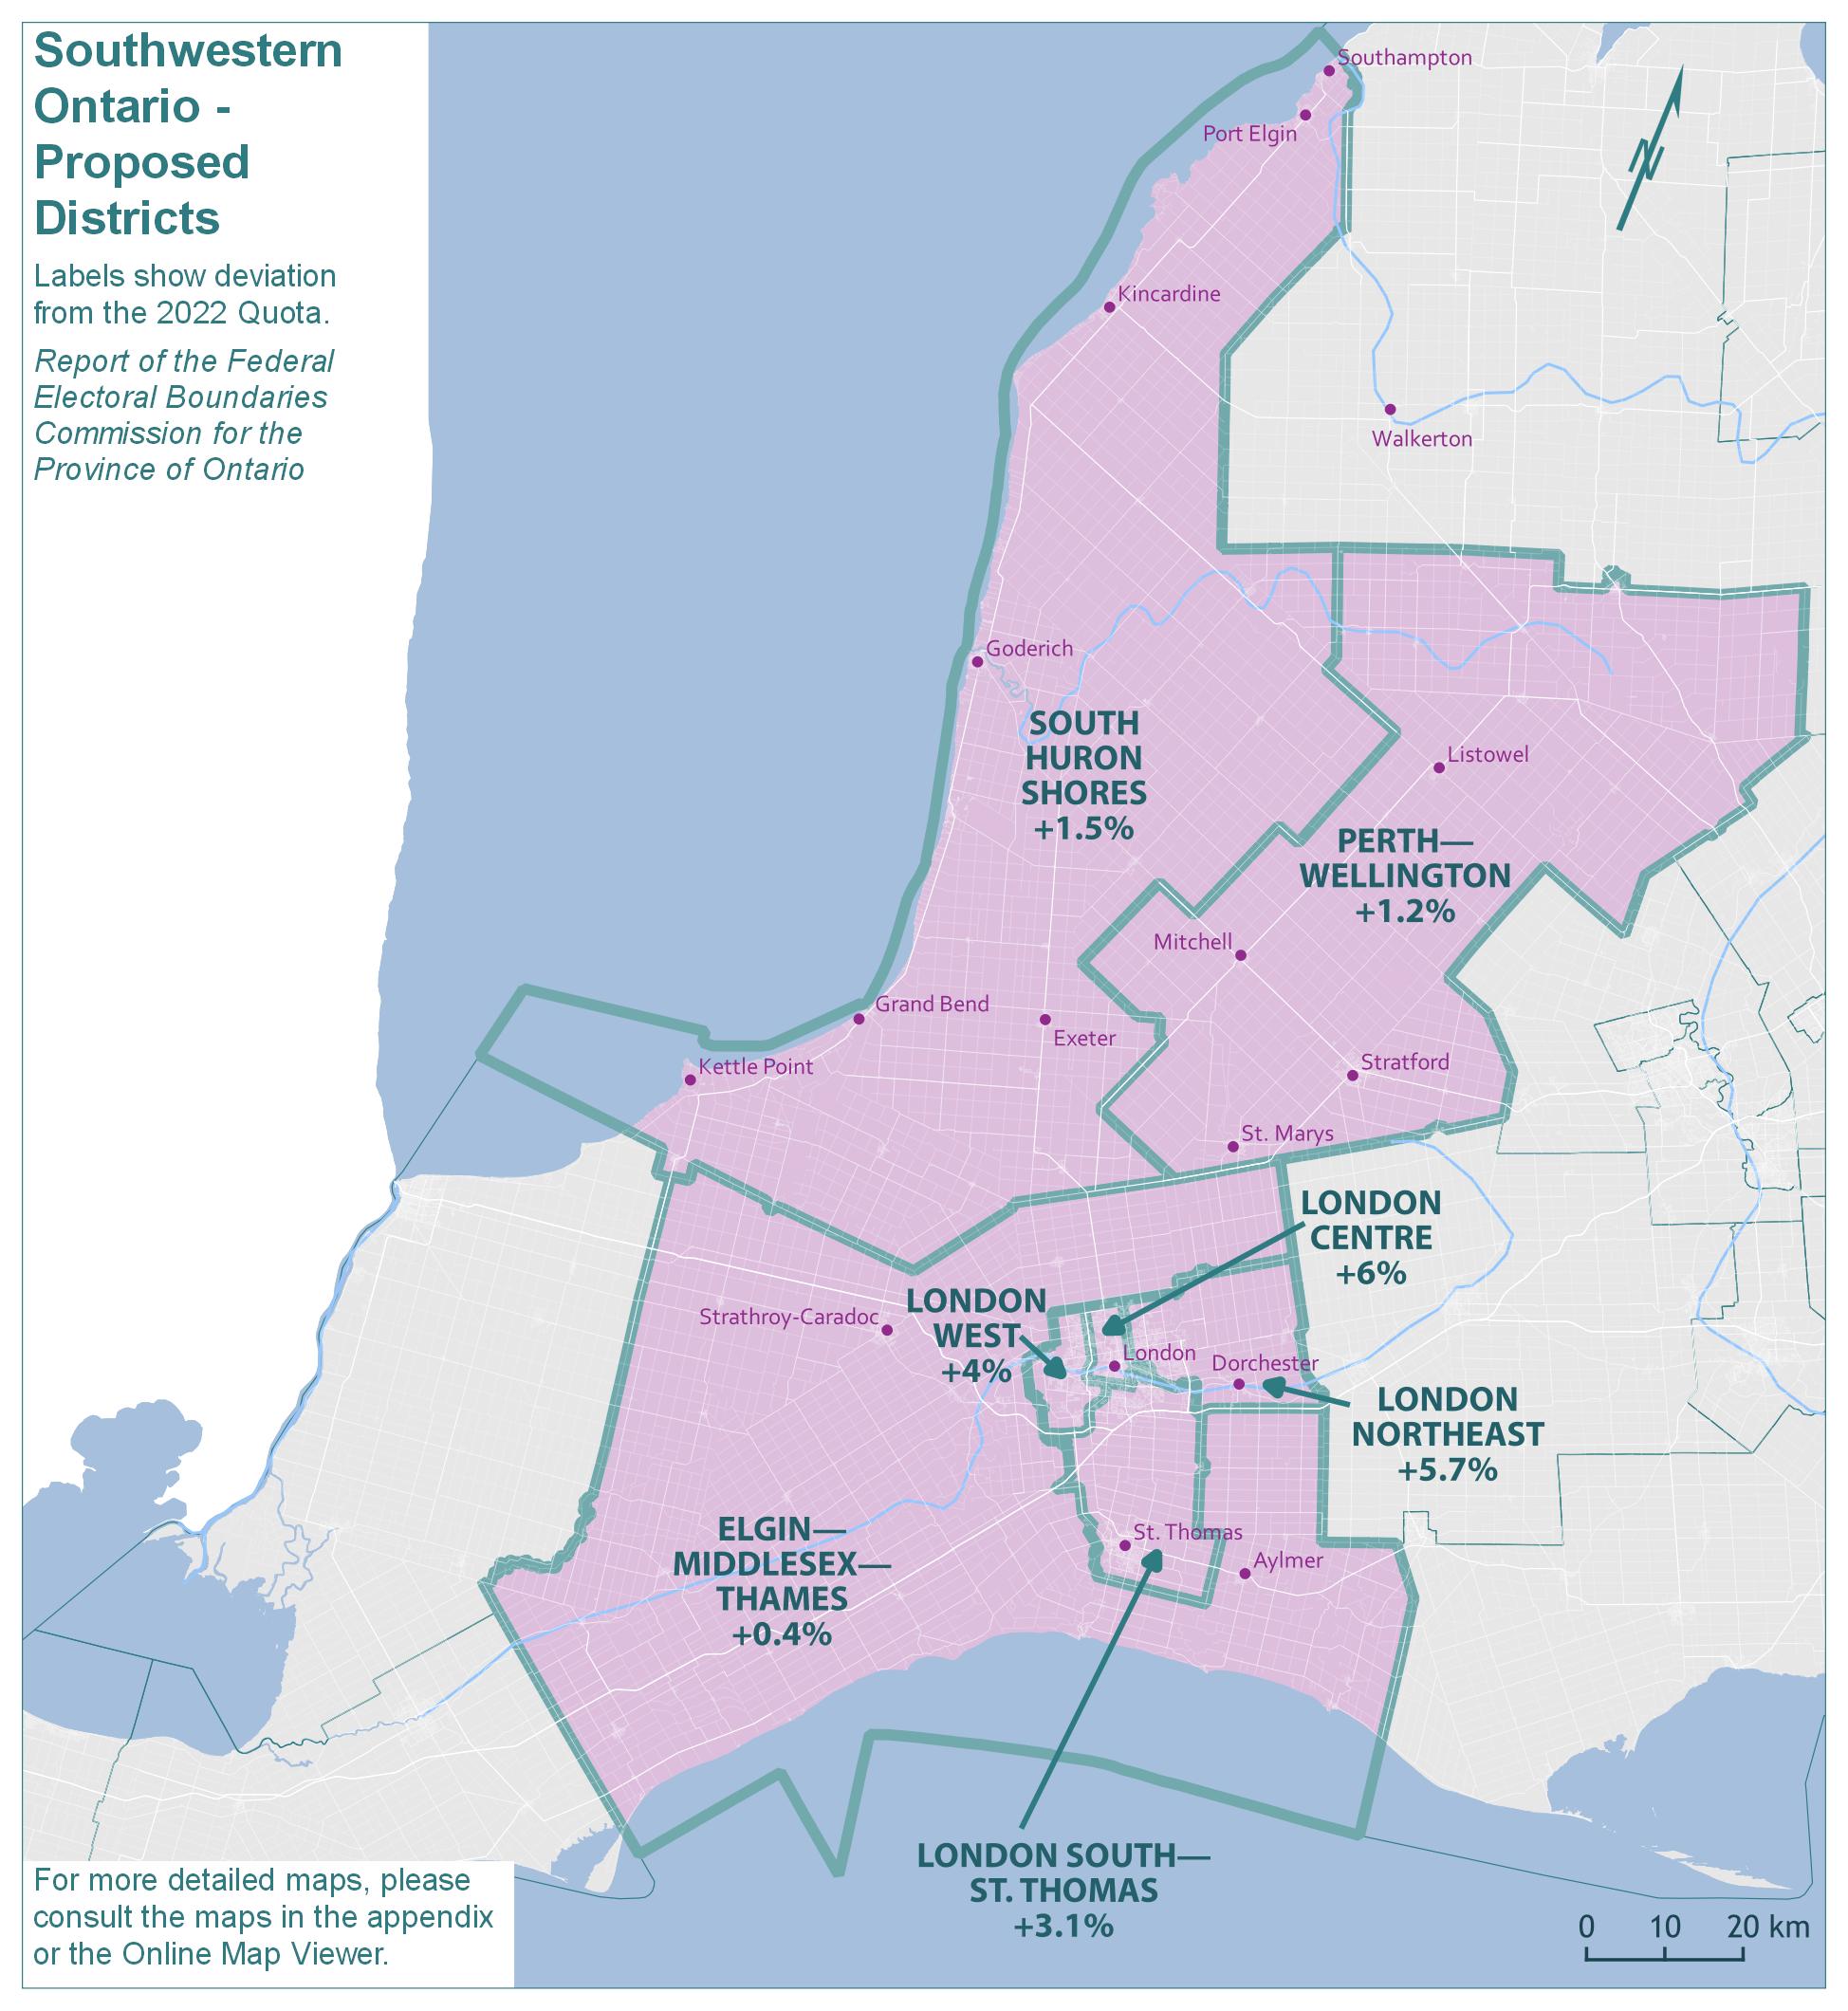
Text version of "Southwestern Ontario - Proposed Districts"
Labels show deviation from the 2022 Quota.
Report of the Federal Electoral Boundaries Commission for the Province of Ontario
For more detailed maps, please consult the maps in the appendix or the Online Map Viewer.
| Electoral district | Deviation |
|---|---|
| Elgin—Middlesex—Thames | 0.4% |
| South Huron Shores | 1.5% |
| London Centre | 6.0% |
| London Northeast | 5.7% |
| London South—St. Thomas | 3.1% |
| London West | 4.0% |
| Perth—Wellington | 1.2% |
Southwestern Ontario - Final Districts
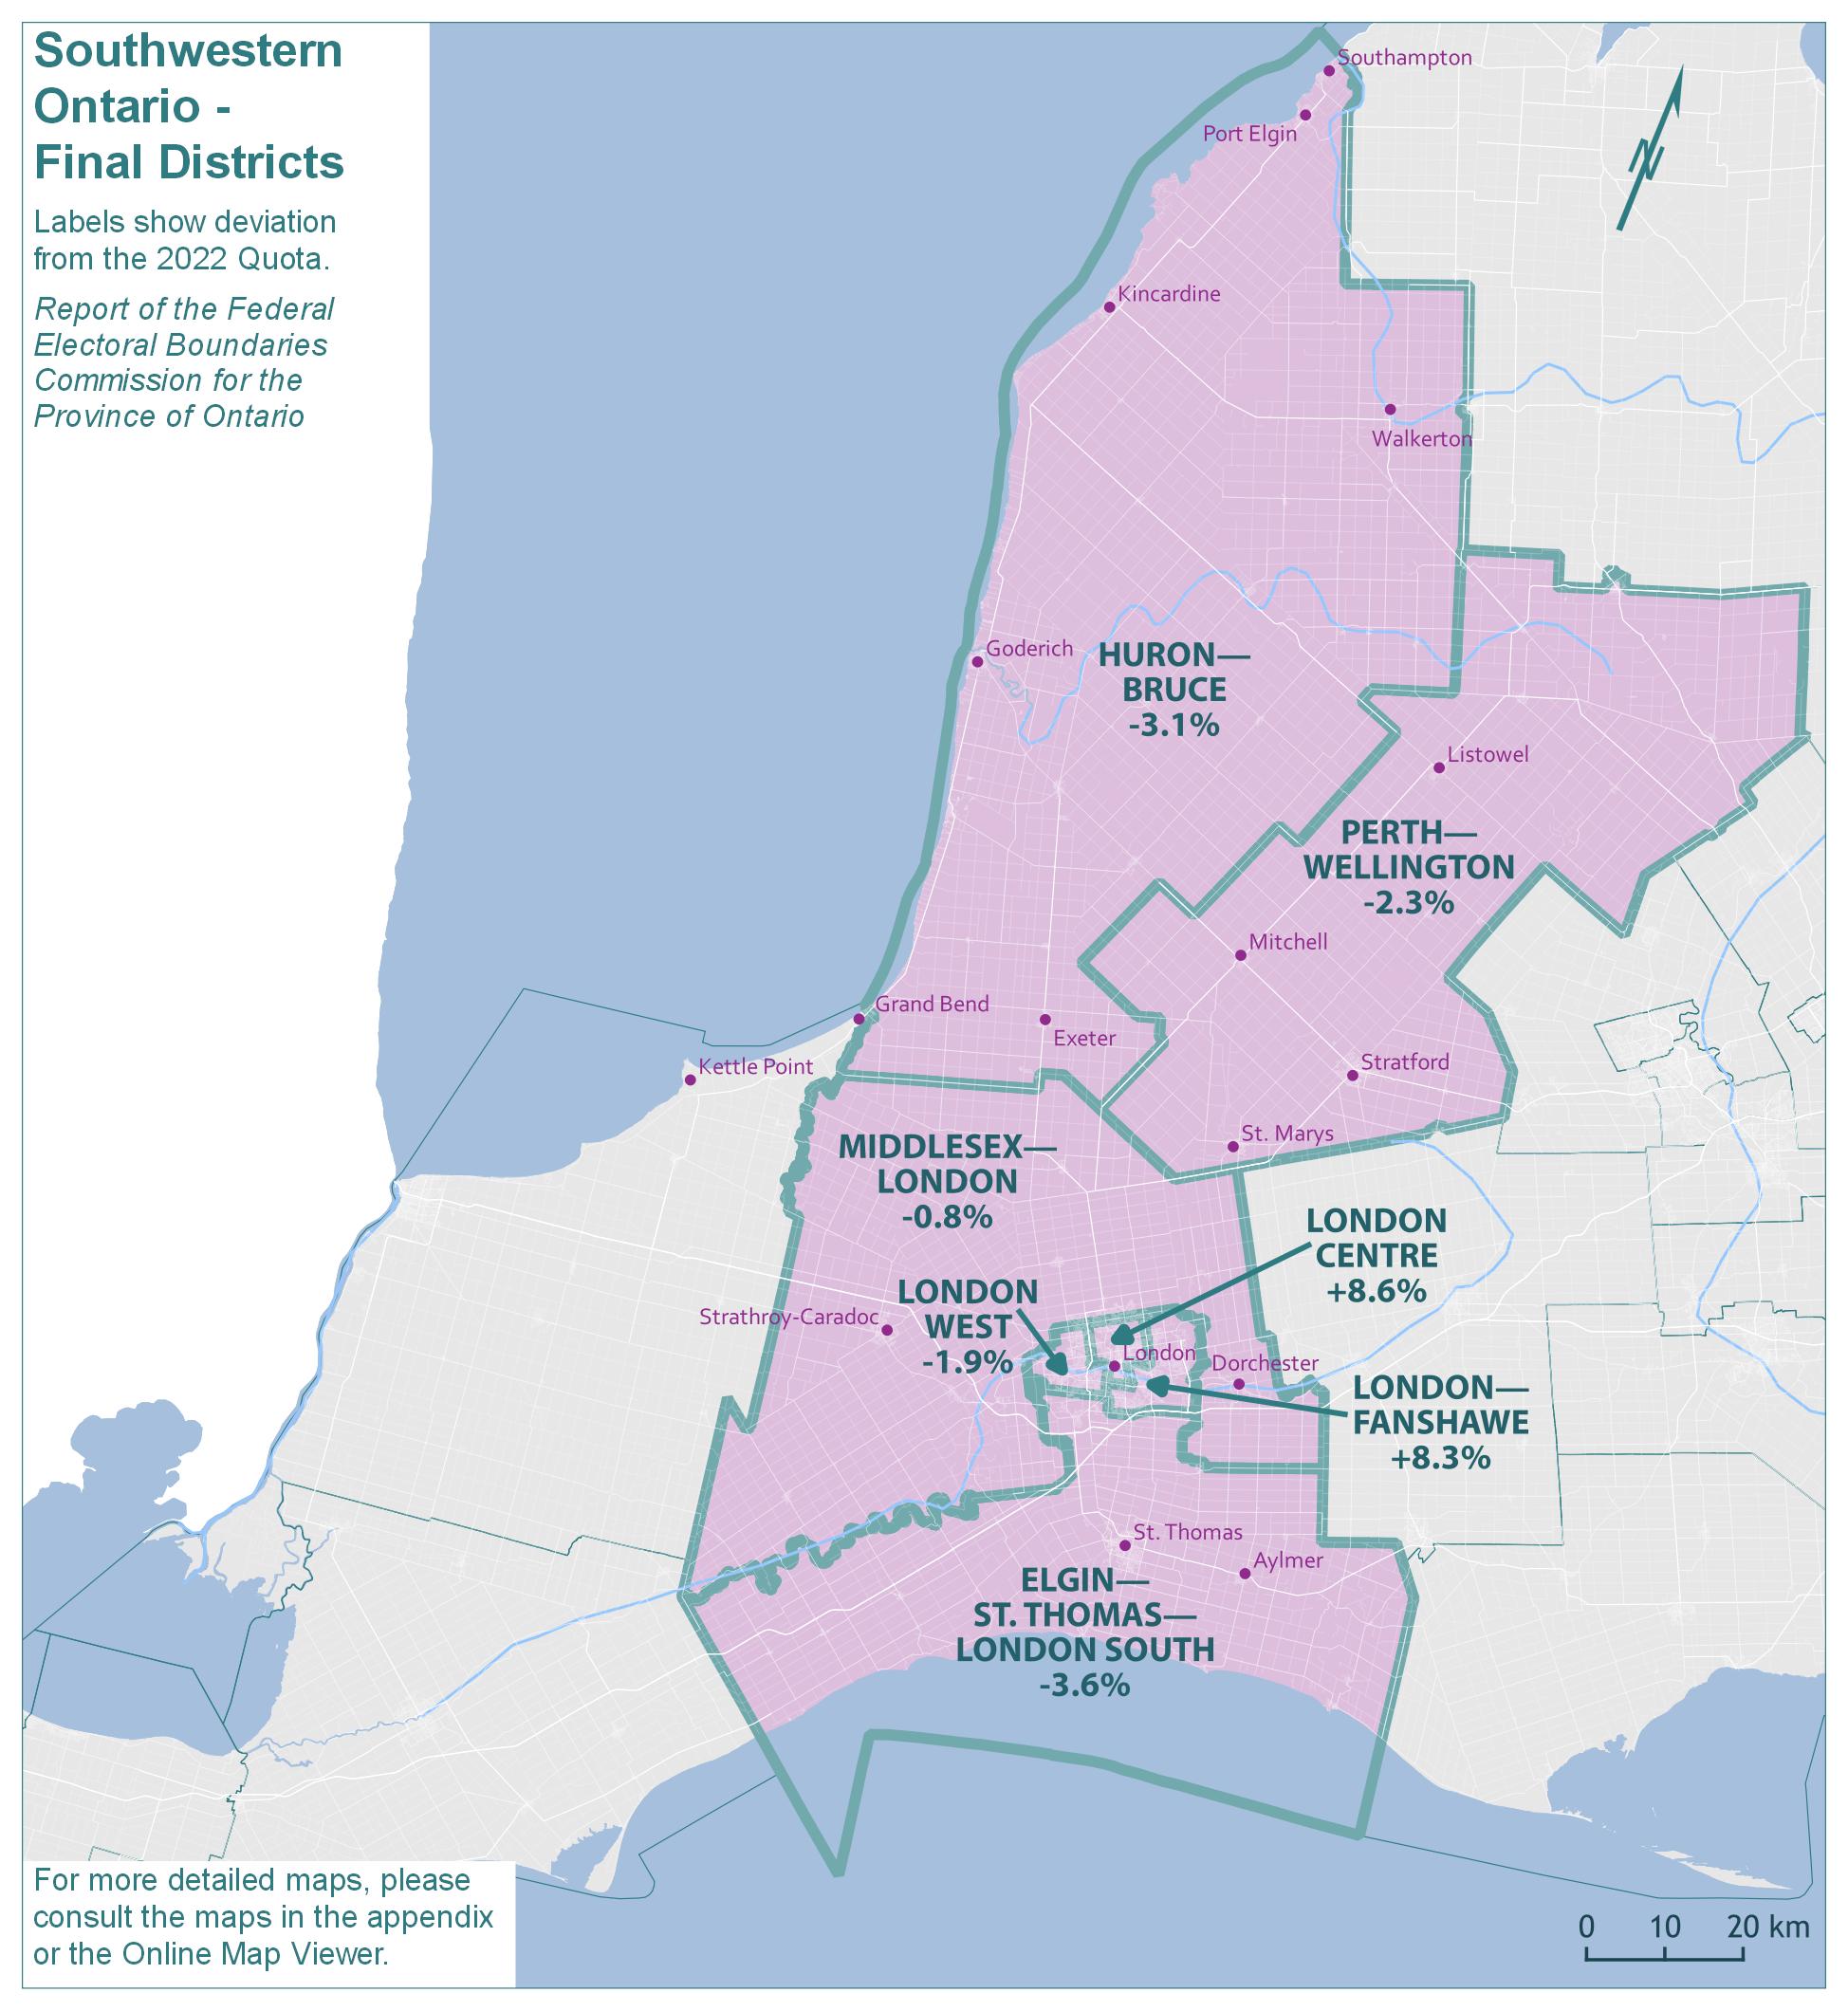
Text version of "Southwestern Ontario - Final Districts"
Labels show deviation from the 2022 Quota.
Report of the Federal Electoral Boundaries Commission for the Province of Ontario
For more detailed maps, please consult the maps in the appendix or the Online Map Viewer.
| Electoral district | Deviation |
|---|---|
| Elgin—St. Thomas—London South | -3.6% |
| Huron—Bruce | -3.1% |
| London Centre | 8.6% |
| London West | -1.9% |
| London—Fanshawe | 8.3% |
| Middlesex—London | -0.8% |
| Perth—Wellington | -2.3% |
The population of Southwestern Ontario grew by 11.1%, from 782,285 in 2011 to 869,137 in 2021. The remainder of Ontario grew by 10.6% in the same period.
The existing seven electoral districts in this geographic piece would have an average 2021 population of 124,162 and an average deviation of 6.5% from the Quota. The absolute range between the least and most populous districts would be 24.1 percentage points. The populations and deviations from the Quota for the existing electoral districts are shown in Table 14A.
| Electoral Districts | Population – 2011 | Deviation from Quota – 2012 | Population – 2021 | Deviation from Quota – 2022 |
|---|---|---|---|---|
| Elgin—Middlesex—London | 110,109 | +3.67% | 126,428 | +8.44% |
| Huron—Bruce | 104,842 | -1.29% | 112,929 | -3.14% |
| Lambton—Kent—Middlesex | 105,919 | -0.28% | 111,242 | -4.59% |
| London—Fanshawe | 119,334 | +12.35% | 127,068 | +8.99% |
| London North Centre | 118,079 | +11.17% | 138,255 | +18.58% |
| London West | 119,090 | +12.12% | 139,305 | +19.48% |
| Perth—Wellington | 104,912 | -1.23% | 113,910 | -2.30% |
| Average | 111,755 | +5.22% | 124,162 | +6.49% |
| Range (most populous to least populous) | 14,492 | 13.64 pp | 28,063 | 24.07 pp |
pp = percentage points
With respect to the proposed redistribution plan for Southwestern Ontario, the Commission noted that the three existing and largely urban districts within the City of London are underrepresented with populations that are 9%, 18.6% and 19.5% above the Quota. Consequently, considerable redrawing was required. The boundaries of these three districts were reconfigured to better balance populations with adjacent and more rural districts. The southern part of the City of London and the northern part of the City of St. Thomas were both included in the proposed district of London South—St. Thomas.
In the more northern part of the City of London, the boundaries of London West and London Centre (the existing district of London North Centre) were modestly changed. The boundaries of the existing district of London—Fanshawe are shifted to the east, and this proposed district was renamed London Northeast.
In the southern portion of this geographic piece, the newly named proposed district of Elgin—Middlesex—Thames was extended from Kent Bridge Road (County Road 15) in Chatham-Kent at its western edge, and wrapped around the City of London along the east. This proposed district comprised portions of the existing districts of Elgin—Middlesex—London and Lambton—Kent—Middlesex.
In the northern portion of this geographic piece, the proposed districts of Perth—Wellington and the newly named South Huron Shores (the existing district of Huron—Bruce) had received minor changes.
Many of these proposed districts were renamed to, in the belief of the Commission, better describe their locations and reflect their communities of interest. The populations and deviations from Quota of the proposed districts are shown in Table 14B.
| Electoral Districts | Population – 2021 | Deviation from Quota – 2022 |
|---|---|---|
| Elgin—Middlesex—Thames | 117,082 | +0.42% |
| London Centre | 123,531 | +5.95% |
| London Northeast | 123,241 | +5.70% |
| London South—St. Thomas | 120,208 | +3.10% |
| London West | 121,199 | +3.95% |
| Perth—Wellington | 117,974 | +1.19% |
| South Huron Shores | 118,316 | +1.48% |
| Average | 120,222 | +3.11% |
| Range (most populous to least populous) | 6,449 | 5.53 pp |
pp = percentage points
The Commission received many submissions concerning this geographic piece from residents, municipalities, counties, agricultural associations, the Western Ontario Wardens' Caucus, and elected representatives. There were two major themes across these submissions.
First, the Commission was urged to restore three primarily urban districts in London, as opposed to the two urban districts and two urban-rural mixed districts contemplated in the proposal.
Secondly, many submissions suggested that municipalities and counties should be maintained whole within a single electoral district to preserve their effective and cohesive representation. These submissions were made by municipal leaders and supported by individuals, business organizations, and not-for-profit entities, such as the Western Ontario Wardens' Caucus and various agricultural federations.
For the final districts, the Commission has generated a new map that meets these goals. London will receive three compact urban districts that are similar in layout to the existing districts. Rural districts in both Southwestern Ontario and Southernmost Ontario have been drawn to largely match county boundaries (as was generally done across all of rural Ontario).
The proposed districts of London South—St. Thomas and Elgin—Middlesex—Thames received much criticism for their division of municipalities, the division of Elgin County, and the joining of the City of St. Thomas with urban portions of London.
The County of Elgin, an upper-tier municipality, expressed concern that under the proposed redistribution plan, two of its seven constituent municipalities, namely the Municipality of Central Elgin and the Township of Southwold, were split between two federal districts. The County made a persuasive case, supported by submissions from the Township of Southwold and the Municipality of Central Elgin. There was further support for this reconfiguration from the Town of Aylmer with its shared local identity with these communities, from the Municipality of Dutton/Dunwich with its partnership through Elgin County with the City of St. Thomas, and from the Municipality of Bayham which coordinates efforts with Elgin County and the City of St. Thomas.
The Commission also heard that St. Thomas's interests are aligned with the more rural character of Elgin County and not the City of London.
The Commission recognized that placing the whole of the County of Elgin in one district along with the City of St. Thomas respected communities of interest and preserved relationships fostering effective representation.
The final district of Elgin—St. Thomas—London South encompasses the entirety of the County of Elgin, the City of St. Thomas, and the portions of the City of London south of Southdale Road, Exeter Road, and Highway 401. This represents the less urban areas within the City of London's boundaries, including the community of Lambeth. This portion of London was part of the existing district of Elgin—Middlesex—London, providing for historical continuity.
The Commission heard similar arguments from municipalities within the County of Middlesex. The County of Middlesex and its residents expressed concern that under the proposed redistribution plan the County was divided into five districts creating issues of engagement with, and access to, elected representatives and diluting rural influence. One of the eight local municipalities within the County, the Municipality of Thames Centre, was divided among four districts in the proposal.
The final district of Middlesex—London has been created in response to these concerns. This district encompasses the entirety of the County of Middlesex, including the whole of the Municipality of Thames Centre and the other seven municipalities within the County.
The final district of Middlesex—London also includes a portion of the City of London north of Fanshawe Park Road. While the Commission endeavoured to keep the urban areas of London in three distinctly urban districts, it was impossible to meet this goal in full. Middlesex County has a population of approximately 78,000, which would have a deviation of -33%. At the same time, the three existing urban London districts had a population of 404,628, giving the three districts an average deviation of 16% above Quota. By shifting some of urban London into Middlesex—London, the Commission was able to achieve a deviation of -0.8% for Middlesex—London and an average of 5% for the three London districts.
As noted above, with respect to districts in the City of London, the Commission received several complaints focused on the creation of mixed urban-rural districts which, it was argued, would diminish representation of both urban and rural voters.
The three existing urban districts in London have largely been restored, with changes to bring them as close as reasonably possible to the Quota while respecting neighbourhoods and community boundaries. However, as discussed above, certain parts of London needed to be moved into Middlesex—London. The Commission has drawn the northern boundary for London's three urban districts at Fanshawe Park Road. Approximately 37,000 residents of London have been moved into Middlesex—London, giving the residents considerable demographic weight.
In addition to the northern area discussed above, London West's southeastern boundary has been drawn on Wharncliffe Road, keeping Wortley Village in London Centre. There were different submissions on exactly where the Commission should draw this boundary. We heard many submissions about the importance of Wortley Village, Manor Park, and Berkshire Village. Ultimately, the Commission chose to draw it on Wharncliffe Road because it is a clear boundary that avoids splitting any of these neighbourhoods.
London Centre's northern boundary has been placed on Fanshawe Park Road, as previously discussed. The eastern and western boundaries have been put back to Highbury Avenue and Wonderland Road, as they were in the existing boundaries. This has ensured that the Old East Village has remained wholly within this district, as was requested by several submitters. A large portion of London Centre's southern boundary has been moved southward, bringing the neighbourhood of Wortley Village into the district.
The proposed district of London Northeast has been re-drawn to a district that closely resembles the existing district of London—Fanshawe, with the only exception being the previously discussed section north of Fanshawe Park Road. In light of this, the Commission has chosen to restore the existing name of London—Fanshawe. The Commission received several submissions requesting the preservation of this name, noting that this has been a district name for decades.
The City of Stratford supported the proposed boundaries for the riding of Perth—Wellington and observed that it was of vital importance that the City of Stratford, the County of Perth and the Town of St. Marys be in the same district given their long history of integration and cooperation and their social and economic intertwinement. There was also support for the retention of Municipality of North Perth and northern Wellington County in the same district.
One change has been made to the proposed district of Perth—Wellington. The Township of Howick has been moved into South Huron Shores (renamed Huron—Bruce). Perth—Wellington's boundaries now match the existing district boundaries.
In relation to the proposed district of South Huron Shores, the Commission received criticism for ignoring county limits, and also for its proposed name on the basis that such a name was not descriptive of the whole district. The Commission found these submissions reasonable and reverted to the original district name Huron—Bruce.
Huron—Bruce has been returned to its existing boundaries. By returning to its existing boundaries, the municipalities of Huron County have been united. The southern boundary has been shifted northward to the Huron County limit and the Township of Howick has been returned to the district.
The County of Huron, along with the Municipality of Central Huron, the Township of North Huron and the Municipality of Morris-Turnberry supported the request of the Township of Howick to be realigned with the County given its common concerns, partnerships and shared services with all of the other lower-tier municipalities in the County.
The Municipalities of Brockton and South Bruce also opposed its proposed alignment with Bruce—Grey—Owen Sound and sought to remain in what has been named the Huron—Bruce district. This aligns them with several other municipalities in Bruce County. The Commission implemented this request focused on preserving that community's representational relationships.
The names, populations and deviations from the Quota for Southwestern Ontario's final districts are shown in Table 14C.
| Electoral Districts | Population – 2021 | Deviation from Quota – 2022 |
|---|---|---|
| Elgin—St. Thomas—London South | 112,448 | -3.55% |
| Huron—Bruce | 112,929 | -3.14% |
| London Centre | 126,597 | +8.58% |
| London—Fanshawe | 126,286 | +8.32% |
| London West | 114,374 | -1.90% |
| Middlesex—London | 115,610 | -0.84% |
| Perth—Wellington | 113,929 | -2.28% |
| Average | 117,453 | +0.74% |
| Range (most populous to least populous) | 14,149 | 12.13 pp |
pp = percentage points
Southernmost Ontario
Southernmost Ontario - Existing Districts
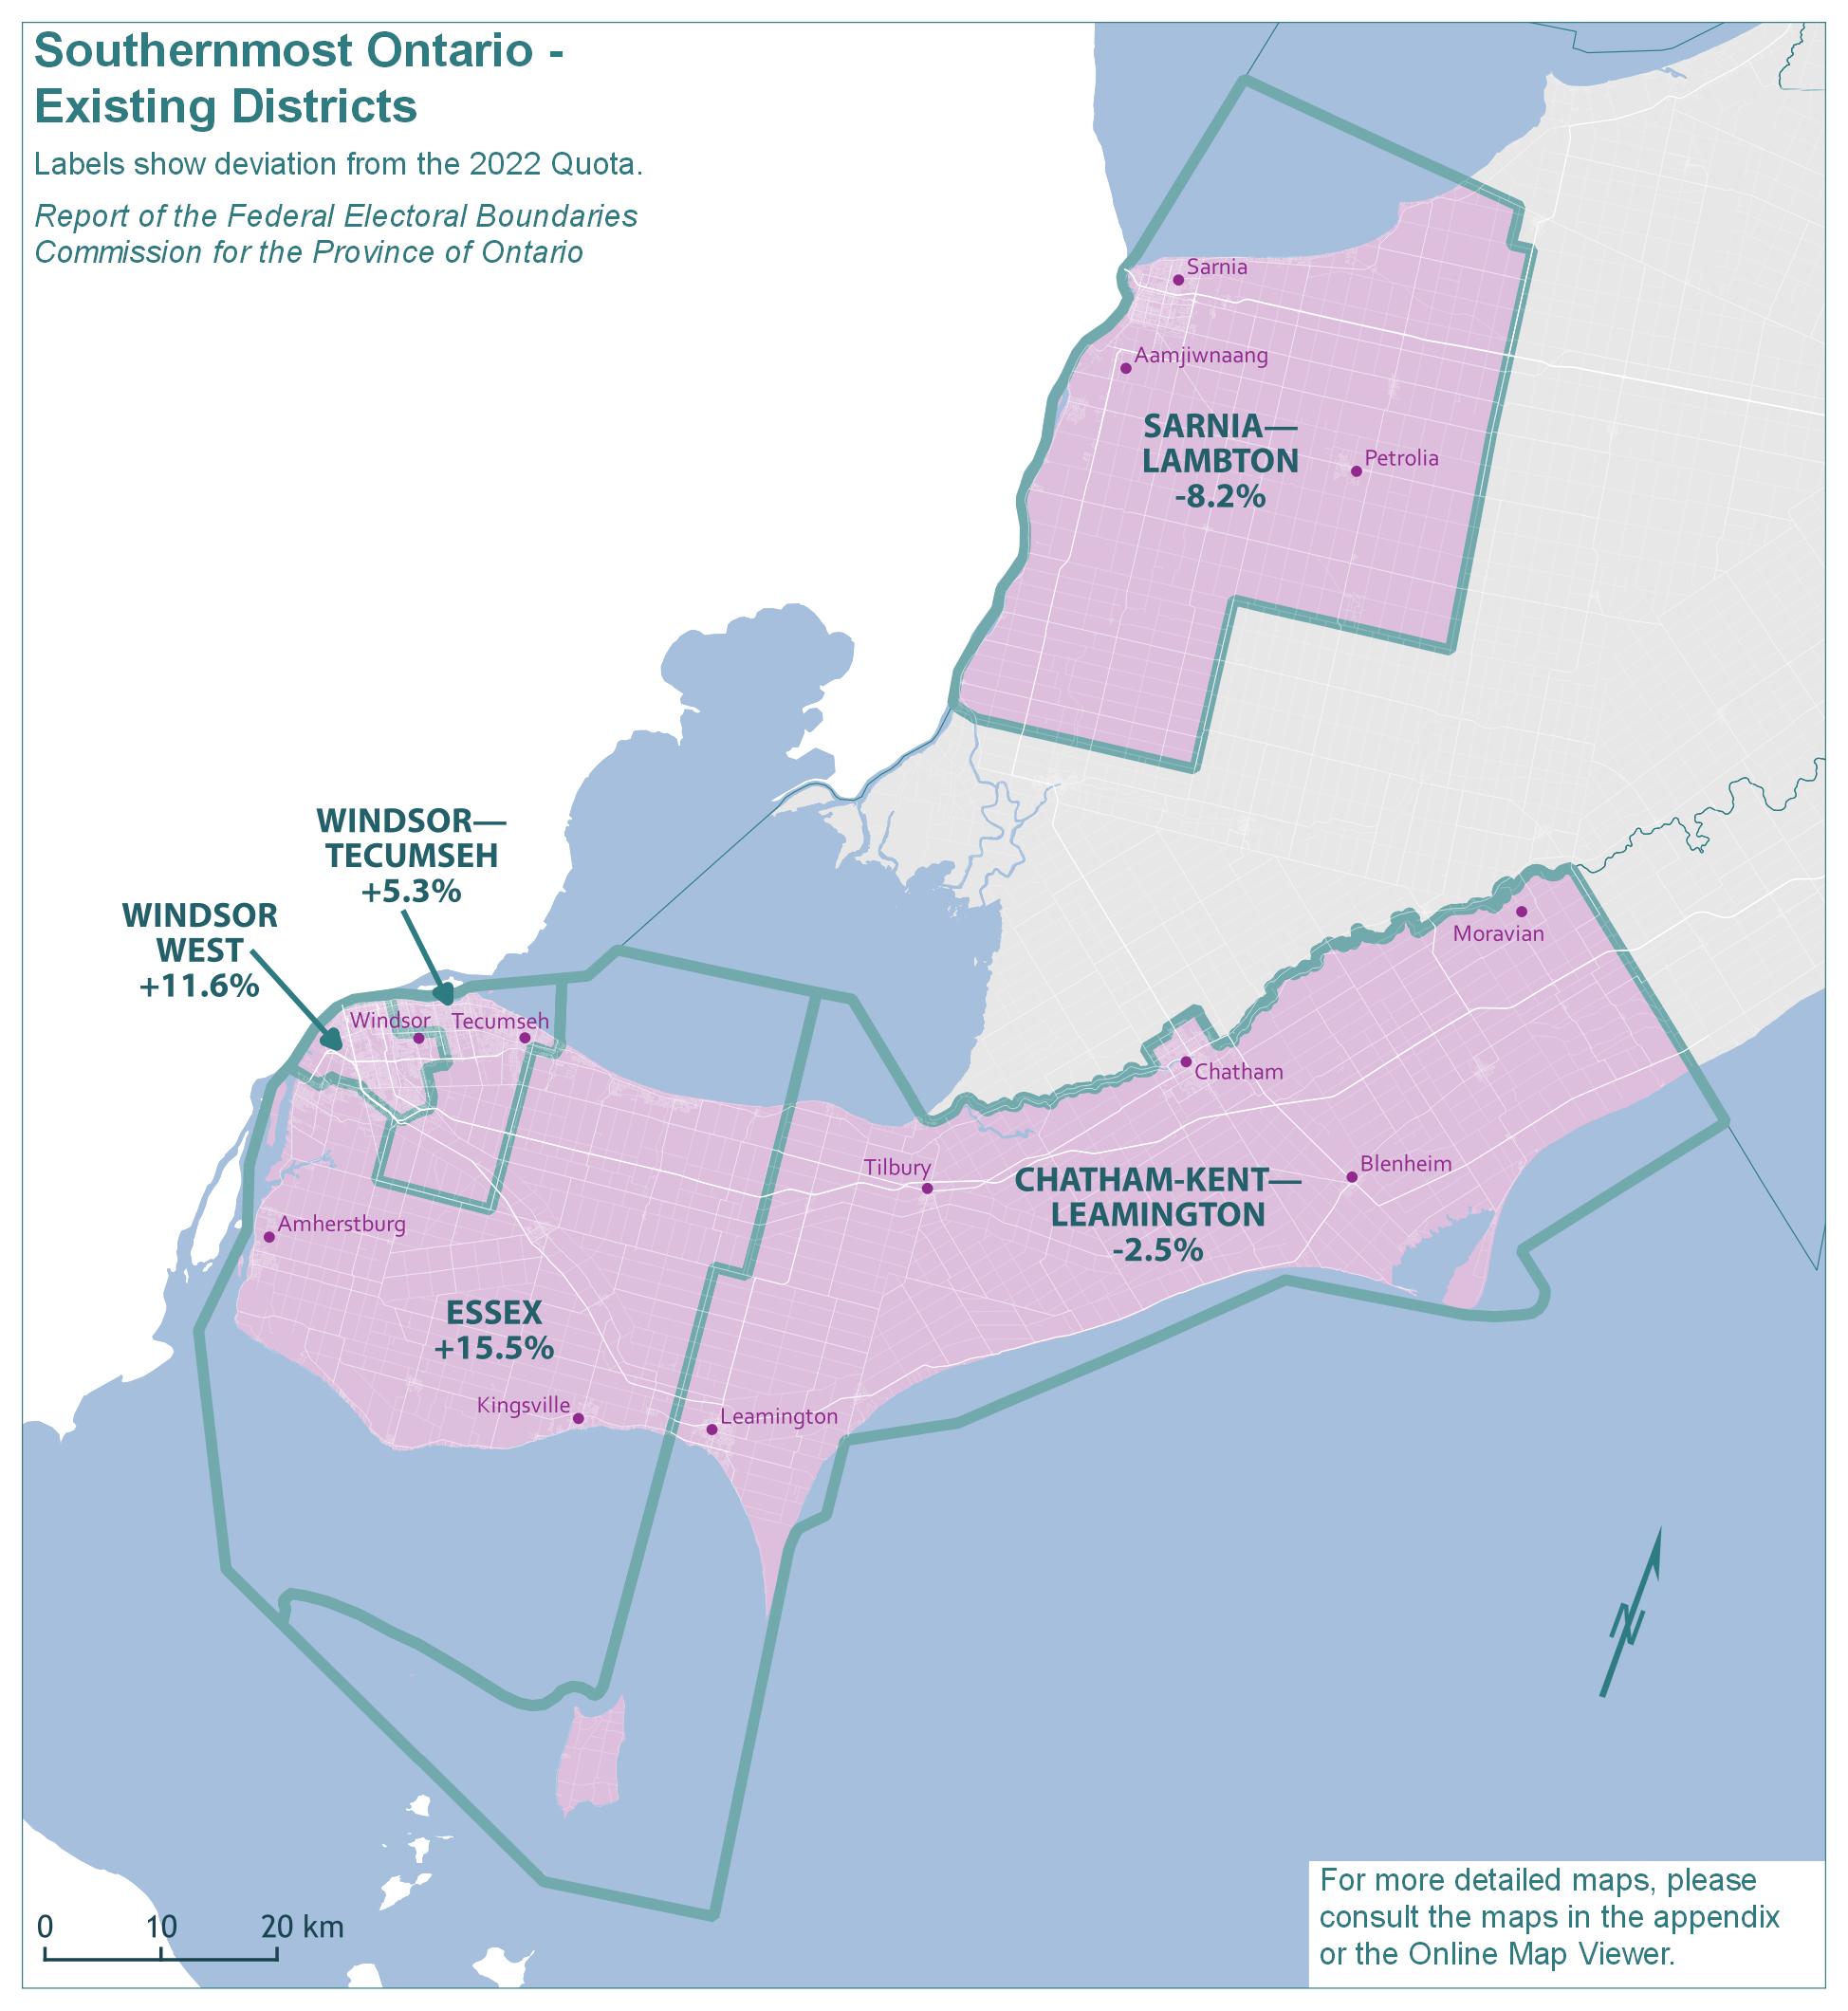
Text version of "Southernmost Ontario - Existing Districts"
Labels show deviation from the 2022 Quota.
Report of the Federal Electoral Boundaries Commission for the Province of Ontario
For more detailed maps, please consult the maps in the appendix or the Online Map Viewer.
| Electoral district | Deviation |
|---|---|
| Chatham-Kent—Leamington | -2.5% |
| Essex | 15.5% |
| Sarnia—Lambton | -8.2% |
| Windsor West | 11.6% |
| Windsor—Tecumseh | 5.3% |
Southernmost Ontario - Proposed Districts
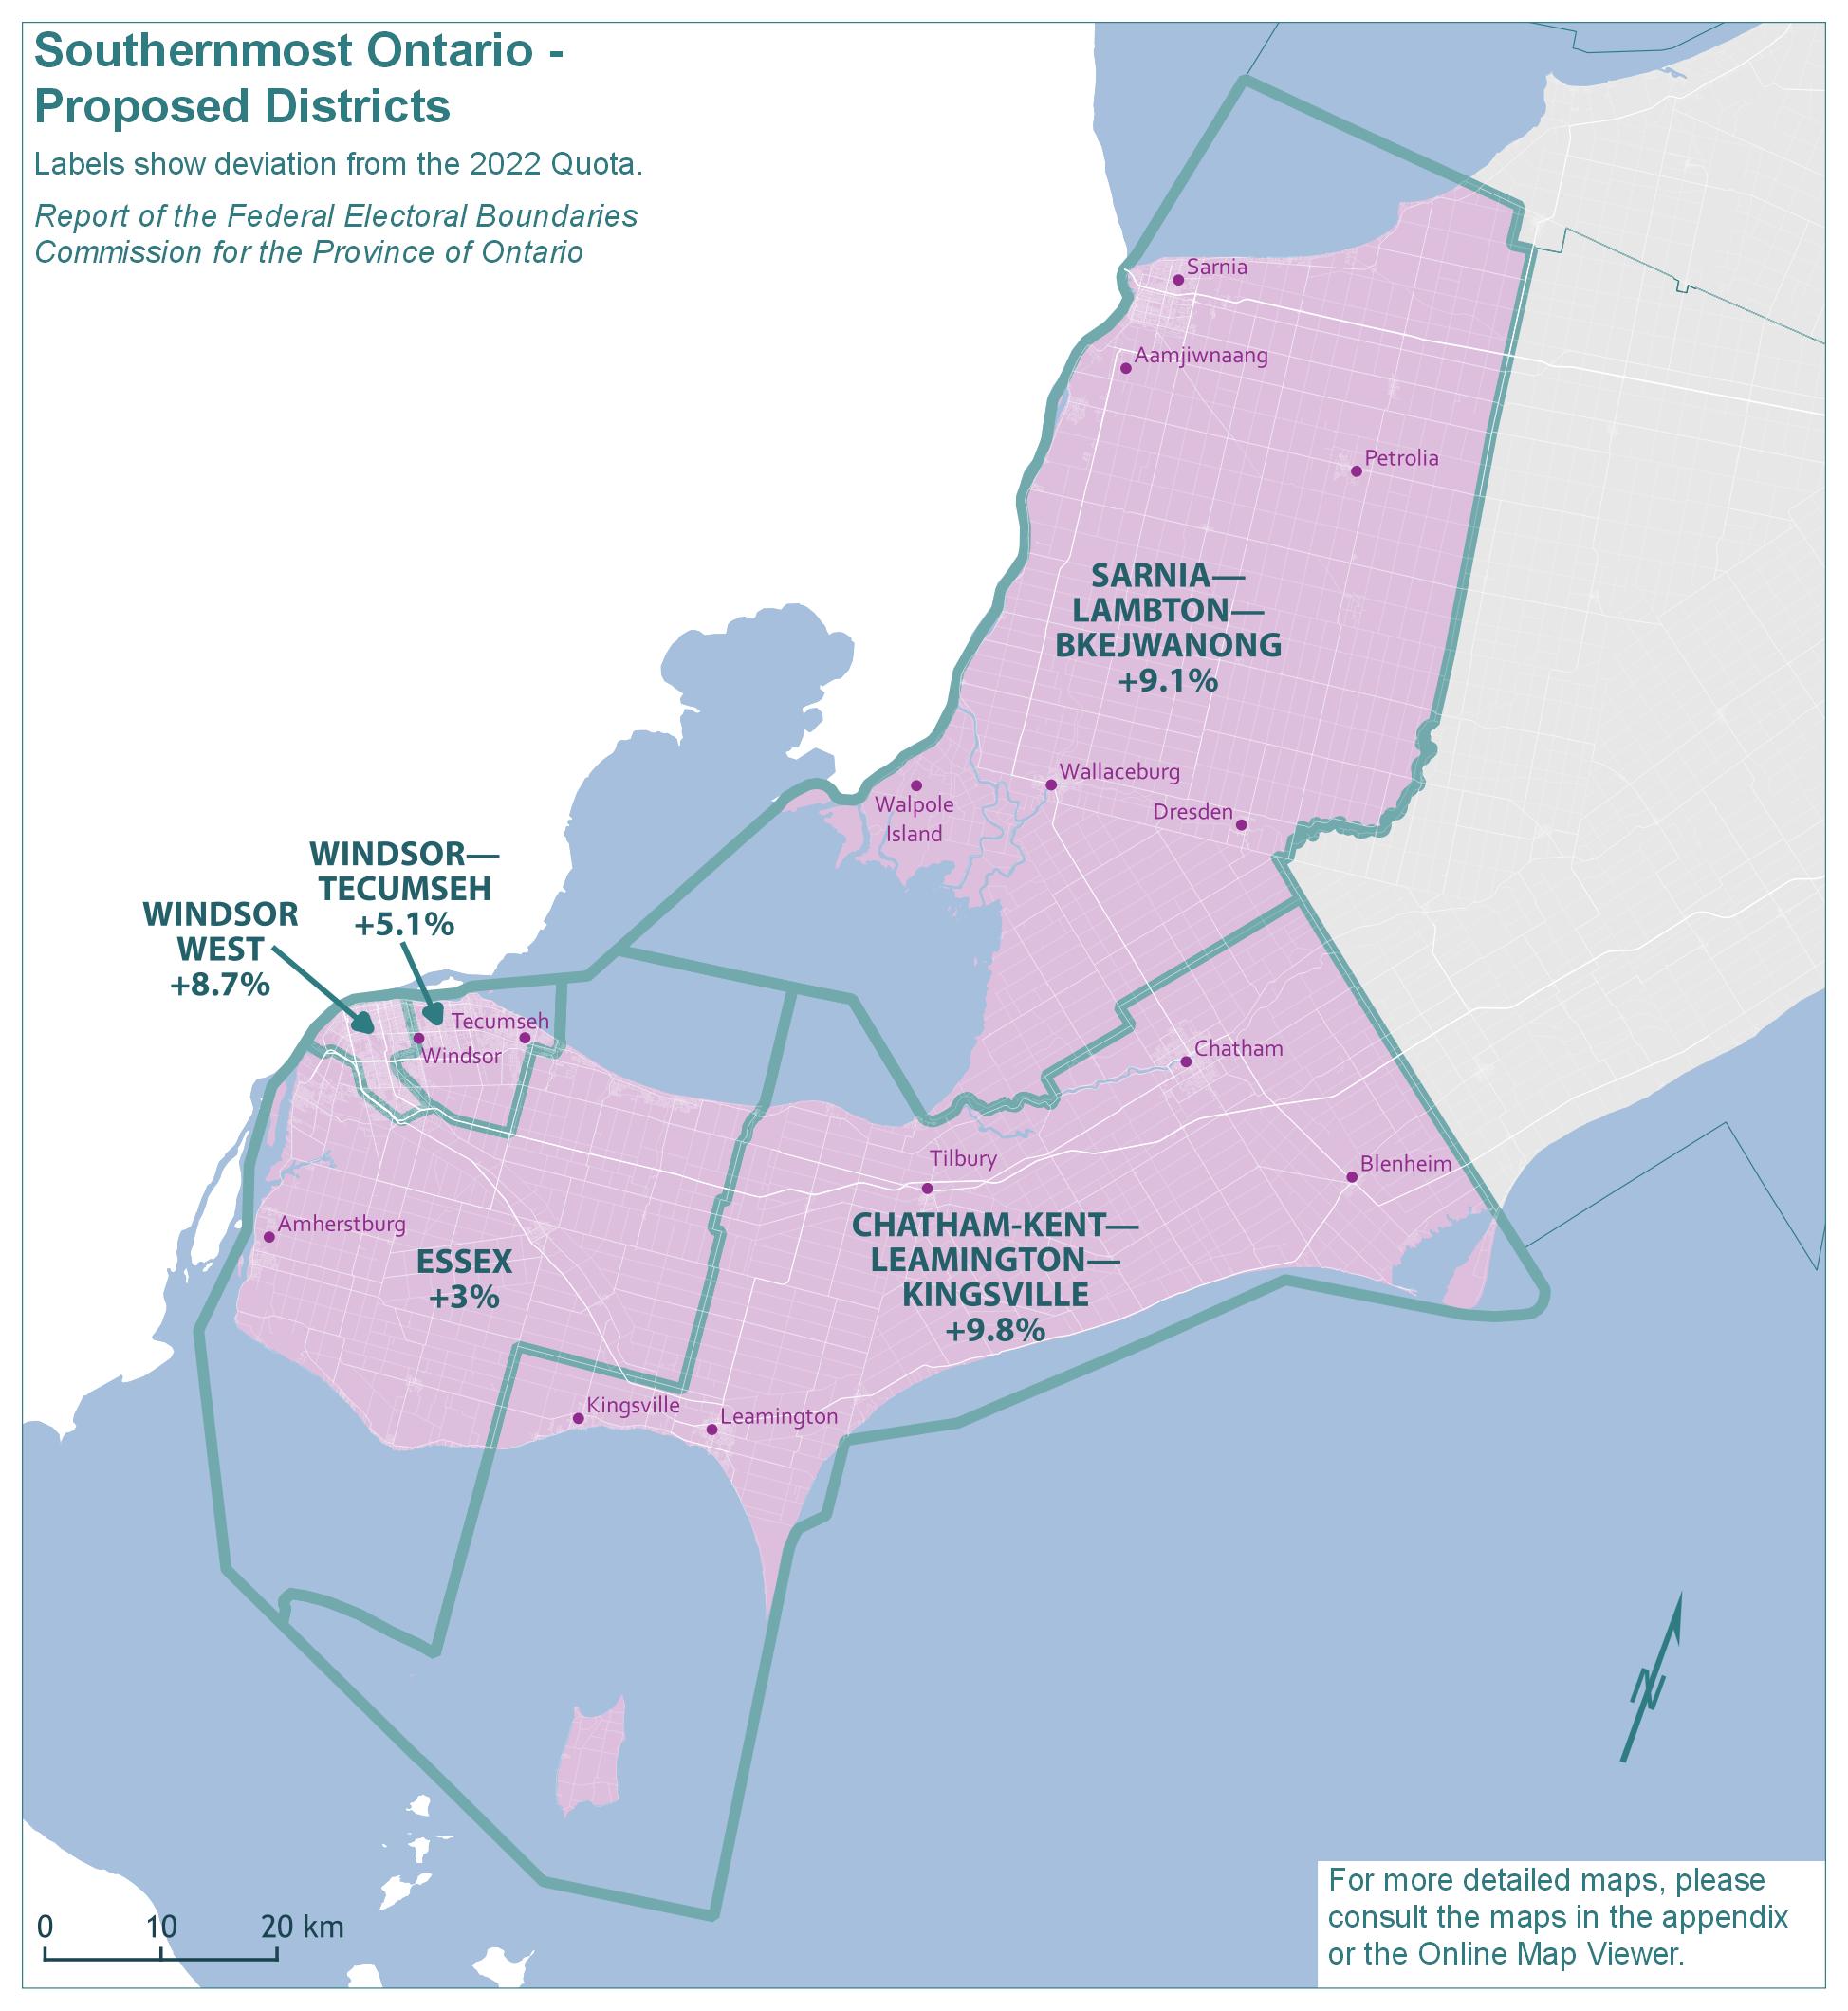
Text version of "Southernmost Ontario - Proposed Districts"
Labels show deviation from the 2022 Quota.
Report of the Federal Electoral Boundaries Commission for the Province of Ontario
For more detailed maps, please consult the maps in the appendix or the Online Map Viewer.
| Electoral district | Deviation |
|---|---|
| Chatham-Kent—Leamington—Kingsville | 9.8% |
| Essex | 3.0% |
| Sarnia—Lambton—Bkejwanong | 9.1% |
| Windsor—Tecumseh | 5.1% |
| Windsor West | 8.7% |
Southernmost Ontario - Final Districts
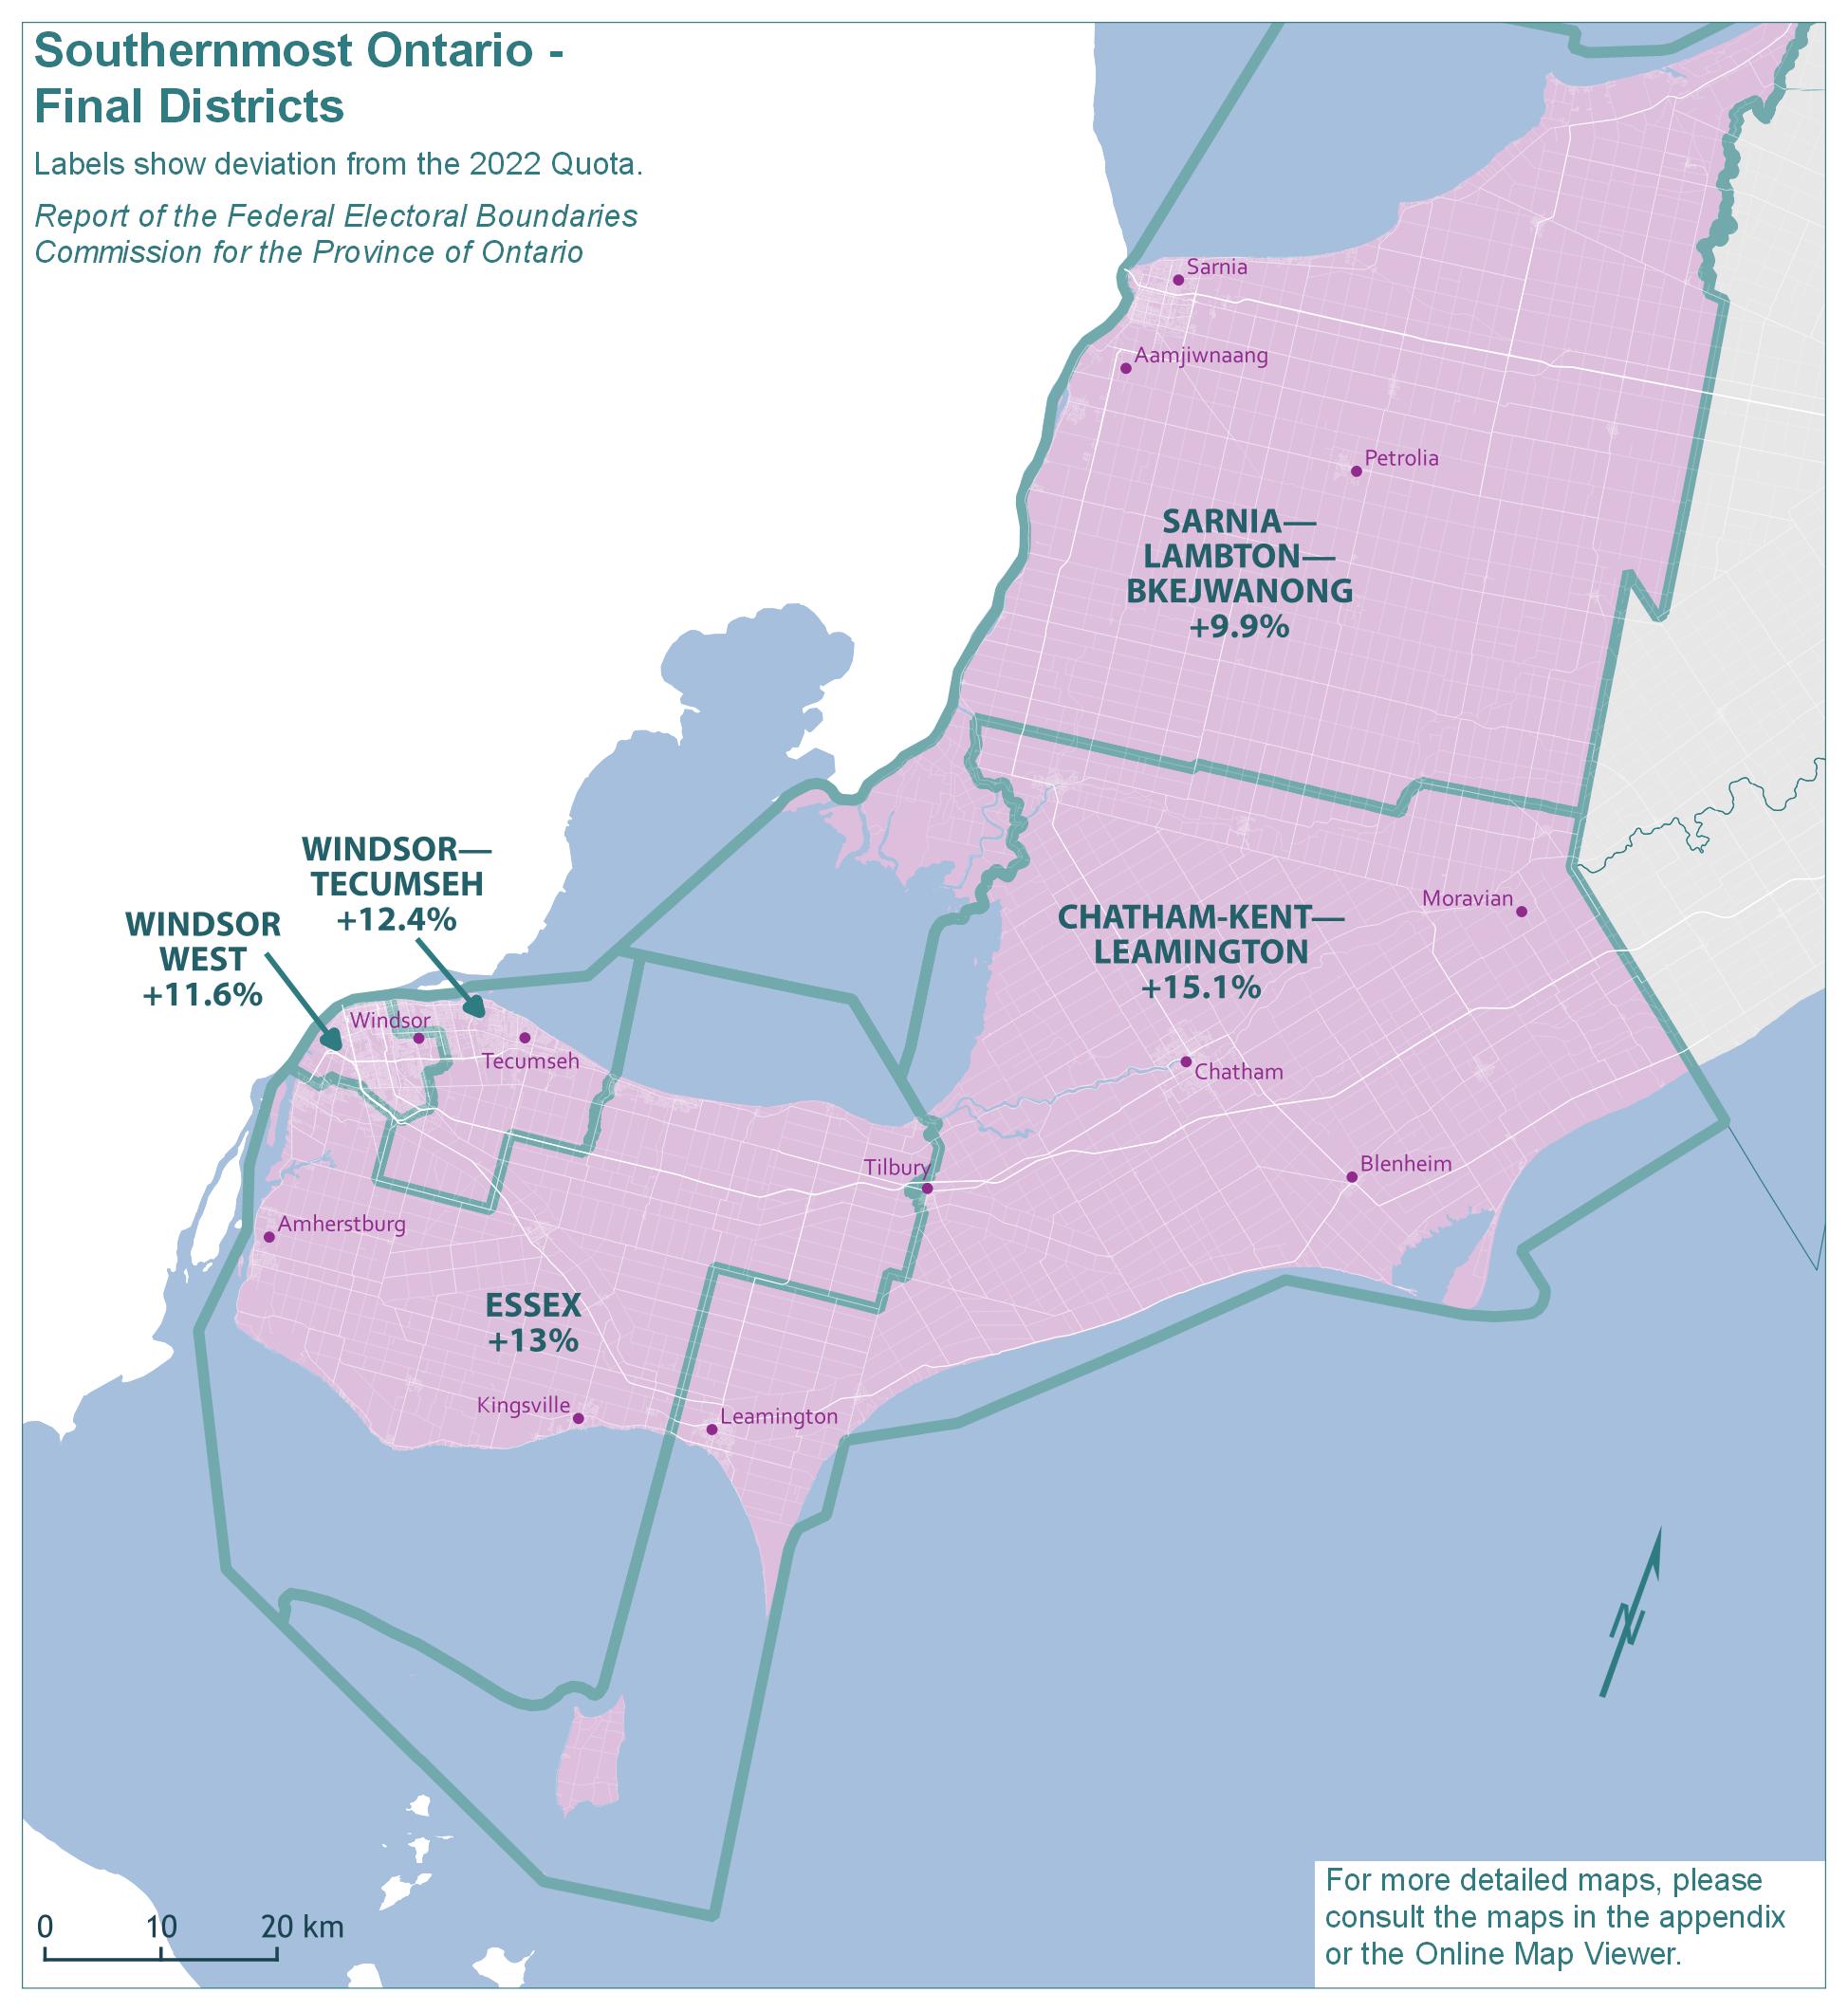
Text version of "Southernmost Ontario - Final Districts"
Labels show deviation from the 2022 Quota.
Report of the Federal Electoral Boundaries Commission for the Province of Ontario
For more detailed maps, please consult the maps in the appendix or the Online Map Viewer.
| Electoral district | Deviation |
|---|---|
| Chatham-Kent—Leamington | 15.1% |
| Essex | 13% |
| Sarnia—Lambton—Bkejwanong | 9.9% |
| Windsor West | 11.6% |
| Windsor—Tecumseh | 12.4% |
The population of the southernmost part of Ontario grew by 6.1%, from 573,137 in 2011 to 608,347 in 2021. The remainder of Ontario grew by 10.9% in the same period.
The existing five electoral districts in this geographic piece would have an average 2021 population of 121,669 and an average deviation of 4.4% above the Quota. As indicated by the deviation range (23.7 percentage points), there are substantial disparities in the population size of districts. The populations and deviations from the Quota for the existing electoral districts are shown in Table 15A.
| Electoral Districts | Population – 2011 | Deviation from Quota – 2012 | Population – 2021 | Deviation from Quota – 2022 |
|---|---|---|---|---|
| Chatham-Kent—Leamington | 111,866 | +5.32% | 113,654 | -2.52% |
| Essex | 120,477 | +13.43% | 134,656 | +15.50% |
| Sarnia—Lambton | 106,293 | +0.07% | 107,077 | -8.16% |
| Windsor—Tecumseh | 115,528 | +8.77% | 122,798 | +5.32% |
| Windsor West | 118,973 | +12.01% | 130,162 | +11.64% |
| Average | 114,627 | +7.92% | 121,669 | +4.36% |
| Range (most populous to least populous) | 14,184 | 13.36 pp | 27,579 | 23.66 pp |
pp = percentage points
In the proposed redistribution plan for Southernmost Ontario, the Commission aimed to reduce the significant population disparities among districts. This necessitated shifting the boundary of the existing district of Essex westward to reduce its population size. The community of Kingsville was incorporated into the proposed district of Chatham-Kent—Leamington—Kingsville. The communities of Wallaceburg and Dresden and the Walpole Island First Nation were added to the proposed district of Sarnia—Lambton—Bkejwanong. The boundaries of the proposed districts of Windsor West and Windsor—Tecumseh were adjusted to balance population equality. The populations and deviations from the Quota for the proposed districts are shown in Table 15B.
| Electoral Districts | Population – 2021 | Deviation from Quota – 2022 |
|---|---|---|
| Chatham-Kent—Leamington—Kingsville | 128,045 | +9.83% |
| Essex | 120,132 | +3.04% |
| Sarnia—Lambton—Bkejwanong | 127,200 | +9.10% |
| Windsor—Tecumseh | 122,533 | +5.10% |
| Windsor West | 126,695 | +8.67% |
| Average | 124,921 | +7.15% |
| Range (most populous to least populous) | 7,913 | 6.79 pp |
pp = percentage points
The Municipality of Chatham-Kent, a single tier municipality, expressed concern that it was being split from two into three districts. In this final plan, the Commission has reconfigured the boundaries so that the Municipality of Chatham-Kent is within one district. Leamington and Pelee Island have also been placed in this district, as they were in the existing boundaries. This reinforces effective representation of these communities. The name of this district has been returned to the existing name of Chatham-Kent—Leamington.
With respect to the Windsor districts, there were many submissions requesting that communities of interest be preserved and that historical patterns be respected. The Commission found these submissions persuasive and has revised the redistribution plan accordingly.
Windsor West has been returned to its existing boundaries. The Commission received submissions that the proposed southwestern boundary on Huron Church Road and the E.C. Row Expressway was not optimal because it needlessly cut off part of the city. The eastern boundary is also returned to its original boundary, based on submissions suggesting that the Walkerville neighbourhood should be returned to Windsor—Tecumseh.
The boundary for Windsor—Tecumseh has also been changed to include all of the Town of Tecumseh, as it was in the existing boundary. The eastern boundary is also pushed eastward to the Puce River; this satisfies the interests of population equality and is a clear and distinct boundary.
Essex has been re-configured based on these changes. This reconfiguration facilitates the Town of Kingsville remaining within the Essex district, pursuant to many submissions including from the Town of Kingsville itself. The eastern portion of the Municipality of Lakeshore has been moved into the district. The district of Essex has been drawn to match Essex County as much as possible, but with a population of approximately 193,000, this could not be fully achieved.
The district of Sarnia—Lambton—Bkejwanong has received significant change. It has been re-drawn to match Lambton County, as was suggested in several submissions. This is generally consistent with the Commission's approach in rural Ontario to maintain the cohesiveness of upper-tier municipalities and to preserve effective representation.
The Commission also received multiple submissions about the negative impact on effective representation with the proposed division of the Township of Dawn-Euphemia. This included a submission from the municipality itself. Under the final boundaries, Dawn-Euphemia has been maintained wholly within Sarnia—Lambton—Bkejwanong.
Walpole Island First Nation and Chippewas of Kettle and Stony Point First Nation remain together in this new district, along with Aamjiwnaang First Nation. The Commission notes that the Aamjiwnaang First Nation and Chippewas of Kettle and Stony Point First Nation are both members of the Southern First Nations Secretariat Tribal Council.
The Commission notes that the deviations from the Quota in this geographic piece are especially high. The Commission has concluded that geographic considerations and the need for effective representation warrants these deviations. The relatively fewer choices for boundary options on a peninsula, combined with the desire to keep lower-tier and upper-tier municipalities together, makes this plan reasonable. However, this will need to be re-assessed in the future, as the population in this geographic piece shifts.
The names, populations and deviations from the Quota for Southernmost Ontario's final districts are shown in Table 15C.
| Electoral Districts | Population – 2021 | Deviation from Quota – 2022 |
|---|---|---|
| Chatham-Kent—Leamington | 134,226 | +15.13% |
| Essex | 131,691 | +12.95% |
| Sarnia—Lambton—Bkejwanong | 128,154 | +9.92% |
| Windsor—Tecumseh | 131,097 | +12.44% |
| Windsor West | 130,162 | +11.64% |
| Average | 131,066 | +12.42% |
| Range (most populous to least populous) | 6,072 | 5.21 pp |
pp = percentage points
Footnotes
Return to footnote 1 This document was updated on February 24, 2023, correcting an error with respect to the sentence noted above. We confirm that "five" of Toronto's final districts have been returned to their existing boundarie.