Commentaire 21 – commentaires et rétroaction
Les documents ci-dessous sont affichés dans la langue officielle d'origine tels qu'ils ont été reçus.
Retour aux commentaires et rétroaction du public
Sally Martyn, Mayor of the Municipality of Central Elgin
On behalf of Municipality of Central Elgin Mayor Sally Martyn, please see attached correspondence for the consideration of the Federal Electoral Boundaries Commission for Ontario.
September 13, 2022
Re: proposed federal electoral boundaries districts – Federal Electoral Boundaries Commission for Ontario
The Municipality of Central Elgin (Municipality) understands and appreciates the work of the Federal Electoral Boundaries Commission for the Province of Ontario (the Commission) as an independent body charged with readjusting the electoral boundaries under the Electoral Boundaries Readjustment Act (the Act).
The Municipality has reviewed, in great detail, the Commission's proposed new federal electoral district map. As it pertains to the Municipality of Central Elgin, the proposed federal electoral districts unnecessarily fragment the Municipality of Central Elgin. Furthermore, under such proposal:
- The proposed federal electoral districts of Elgin – Middlesex – Thames and London South – St. Thomas do not respect the historical pattern of Municipality of Central Elgin electoral districts.
- Splitting the Municipality of Central Elgin on John Wise Line does not respect the community identity of the Municipality, as it would be practically impossible to argue John Wise Line divides two community identities within the Municipality of Central Elgin.
- The inclusion of the Municipality of Central Elgin in the Elgin – Middlesex – Thomas electoral district is difficult to be considered as a district of "manageable geographic size" in southwestern Ontario. The existing Elgin – Middlesex – London electoral district is 3,557 km2 while the proposed Elgin – Middlesex – Thomas electoral district is 6,262km2.
- The community identity including rural voice of the Municipality of Central Elgin would be significantly diluted across two ridings that would have larger City of London and urban concerns.
- The inclusion of a portion of the Municipality of Central Elgin in the London South – St. Thomas electoral district would take the most populous municipality in Elgin County and dilute its voice across two electoral districts.
- The justification provided by the Commission for the creation of the South London – St. Thomas electoral district does not even consider or acknowledge the Municipality of Central Elgin: Recognizing the development in the southern part of the City of London and the northern part of the City of St. Thomas, these areas are both included in the proposed district of London South – St. Thomas.
- The Municipality of Central Elgin, through Elgin County, partners with the City of St. Thomas on the provision of services, including social services. The proposed electoral districts separate Elgin County from the City of St. Thomas with regard to services that may be closest to the federal sphere of jurisdiction.
- Elgin County, including Municipality of Central Elgin residents, would hold only a minority share of the population of any of the proposed electoral districts that include the Municipality of Central Elgin, diluting the ability to influence the local Member of Parliament to concentrate on and address Central Elgin and Central Elgin residents' interests.
- The Municipality of Central Elgin and municipal community organizations would face greater time and complexity when seeking to engage federal government with the increased likelihood of having to organize two meetings rather than one. Also, there could be the potential for risk of contradictory positions by area Members of Parliament where they represent competing political parties.
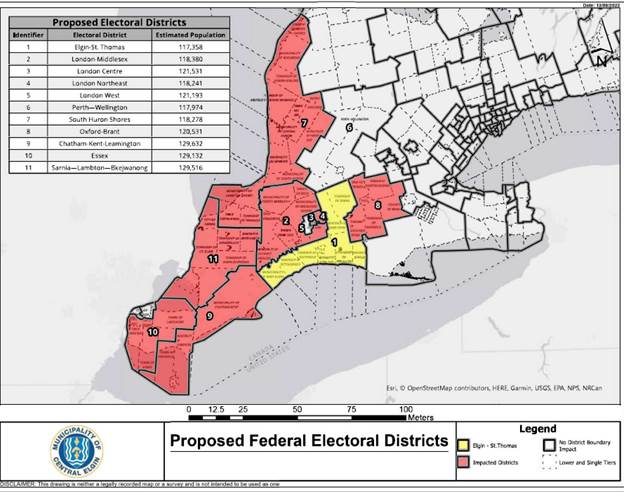
Attached hereto as 'Appendix A' is the proposed federal electoral districts that, in accordance with the Act, ensures that the population in each electoral district shall, as closely as reasonably possible, correspond to the electoral quota for the province. The Municipality of Central Elgin proposal attached hereto improves on the electoral districts population range and percentage point deviation versus the Commission proposal in Table 13B, 14B, and 15B. Further, the Municipality of Central Elgin proposal:
- Respects the community of interest or community of identity in, or the historical pattern of an electoral district in the province, and
- Maintains a manageable geographic size for electoral districts.
No one electoral district can be considered in isolation from the others immediately surrounding it. Any change to one boundary has an inherent effect on at least one adjoining electoral district. The Municipality has endeavoured to respect existing municipal boundaries whenever possible. The proposal from the Municipality of Central Elgin enhances the work of the Commission through reduced average population deviation, respects the community of interest or community of identity in, or the historical pattern of an electoral district in the province, and maintains a manageable geographic size for electoral districts.
Thank you for the opportunity to provide feedback on the Commission's proposals. Please do not hesitate to contact the undersigned should you require any additional information or clarification.
Regards
Mayor Sally Martin
Municipality of Central Elgin
| Name | Count | Percentage |
|---|---|---|
| Elgin – Middlesex – Thames | 117,082 | 0.42% |
| London Centre | 123,531 | 5.95% |
| London Northeast | 123,241 | 5.70% |
| London South – St. Thomas | 120,208 | 3.10% |
| London West | 121,193 | 3.95% |
| Perth – Wellington | 117,974 | 1.19% |
| South Huron Shores | 118,316 | 1.48% |
| Average | 120,221 | 3.11% |
| Range | 6,449 | 5.53% |
| Name | Count | Percentage |
|---|---|---|
| Elgin – Middlesex – Thames | 117,358 | 0.66% |
| London Centre | 118,380 | 1.54% |
| London Northeast | 121,531 | 4.24% |
| London South – St. Thomas | 118,241 | 1.42% |
| London West | 121,193 | 3.95% |
| Perth – Wellington | 117,974 | 1.19% |
| South Huron Shores | 118,278 | 1.45% |
| Average | 118,994 | 2.06% |
| Range | 4,173 | 3.58% |
| Name | Count | Percentage |
|---|---|---|
| Brandford | 118,167 | 1.35% |
| Cambridge | 122,099 | 4.73% |
| Halimand – Norfolk – Six Nations | 122,813 | 5.34% |
| Kitchener Centre | 114,595 | -1.71% |
| Kitchener – Conestoga | 114,856 | -1.49% |
| Kitchen South – North Dumfries | 114,179 | -2.07% |
| Oxford – Brant | 124,844 | 7.08% |
| Waterloo | 121,436 | 4.16% |
| Average | 119,124 | 2.17% |
| Range | 10,665 | 9.15% |
| Name | Count | Percentage |
|---|---|---|
| Brandford | 118,167 | 6.23% |
| Cambridge | 122,099 | 9.76% |
| Halimand – Norfolk – Six Nations | 122,813 | 10.40% |
| Kitchener Centre | 114,595 | 3.01% |
| Kitchener – Conestoga | 114,856 | 3.25% |
| Kitchen South – North Dumfries | 114,179 | 2.64% |
| Oxford – Brant | 120,531 | 8.35% |
| Waterloo | 121,436 | 9.16% |
| Average | 118,585 | 6.60% |
| Range | 8,218 | 7.39% |
| Name | Count | Percentage |
|---|---|---|
| Chatham – Kent – Leamington | 128,045 | 9.83% |
| Essex | 120,132 | 3.04% |
| Sarnia – Lambton | 127,200 | 9.10% |
| Windsor – Tecumseh | 122,533 | 5.10% |
| Windsor West | 126,695 | 8.67% |
| Average | 124,921 | 7.15% |
| Range | 7,913 | 6.79% |
| Name | Count | Percentage |
|---|---|---|
| Chatham – Kent – Leamington | 129.632 | 11.19% |
| Essex | 129,132 | 10.76% |
| Sarnia – Lambton | 129,516 | 11.09% |
| Windsor – Tecumseh | 122,533 | 5.10% |
| Windsor West | 126,695 | 8.67% |
| Average | 127,502 | 9.36% |
| Range | 7,099 | 6.09% |